
2.1– Overview
In the previous chapter we briefly understood what Technical Analysis was all about. In this chapter we will focus on the versatility and the assumptions of Technical Analysis.
2.2 – Application on asset types
Probably one of the greatest versatile features of technical analysis is the fact you can apply TA on any asset class as long as the asset type has historical time series data. Time series data in technical analysis context is information pertaining to the price variables namely – open high, low, close, volume etc.
Here is an analogy that may help. Think about learning how to drive a car. Once you learn how to drive a car, you can literally drive any type of car. Likewise you only need to learn technical analysis once. Once you do so, you can apply the concept of TA on any asset class – equities, commodities, foreign exchange, fixed income etc.
This is also probably one of the biggest advantages of TA when compared to the other fields of study. For example when it comes to fundamental analysis of equity, one has to study the profit and loss, balance sheet, and cash flow statements. However fundamental analysis for commodities is completely different.
If you are dealing with agricultural commodity like Coffee or Pepper then the fundamental analysis includes analyzing rainfall, harvest, demand, supply, inventory etc. However the fundamentals of metal commodities are different, so is for energy commodities. So every time you choose a commodity, the fundamentals change.
However the concept of technical analysis will remain the same irrespective of the asset you are studying. For example, an indicator such as ‘Moving average convergence divergence’ (MACD) or ‘Relative strength index’ (RSI) is used exactly the same way on equity, commodity or currency.
2.3 – Assumption in Technical Analysis
Unlike fundamental analysts, technical analysts don’t care whether a stock is undervalued or overvalued. In fact the only thing that matters is the stocks past trading data (price and volume) and what information this data can provide about the future movement in the security.
Technical Analysis is based on few key assumptions. One needs to be aware of these assumptions to ensure the best results.
1) Markets discount everything – This assumption tells us that, all known and unknown information in the public domain is reflected in the latest stock price. For example there could be an insider in the company buying the company’s stock in large quantity in anticipation of a good quarterly earnings announcement. While he does this secretively, the price reacts to his actions thus revealing to the technical analyst that this could be a good buy.
2) The ‘how’ is more important than ‘why’ – This is an extension to the first assumption. Going with the same example as discussed above – the technical analyst would not be interested in questioning why the insider bought the stock as long he knows how the price reacted to the insider’s action.
3) Price moves in trend – All major moves in the market is an outcome of a trend. The concept of trend is the foundation of technical analysis. For example the recent upward movement in the NIFTY Index to 7700 from 6400 did not happen overnight. This move happened in a phased manner, in over 11 months. Another way to look at it is, once the trend is established, the price moves in the direction of the trend.
4) History tends to repeat itself – In the technical analysis context, the price trend tends to repeat itself. This happens because the market participants consistently react to price movements in a remarkably similar way, each and every time the price moves in a certain direction. For example in up trending markets, market participants get greedy and want to buy irrespective of the high price. Likewise in a down trend, market participants want to sell irrespective of the low and unattractive prices. This human reaction ensures that the price history repeats itself.
2.4 – The Trade Summary
The Indian stock market is open from 9:15 AM to 15:30 PM. During the 6 hour 15 minute market session, there are millions of trades that take place. Think about an individual stock – every minute there is a trade that gets executed on the exchange. The question is, as a market participant, do we need to keep track of all the different price points at which a trade is executed?
To illustrate this further, let us consider this imaginary stock in which there are many trades. Look at the picture below. Each point refers to a trade being executed at a particular time. If one manages to plot a graph which includes every second from 9:15 AM to 15:30 PM, the graph will be cluttered with many points. Hence in the chart below, for ease of understating I’ve plotted a limited time scale period:
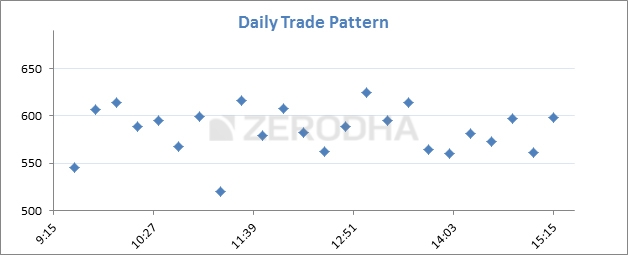
Market opened at 9:15 AM and closed at 15:30 PM during which there were many trades. It will be practically impossible to track all these different price points. In fact what one needs is a summary of the trading action and not really the details on all the different price points.
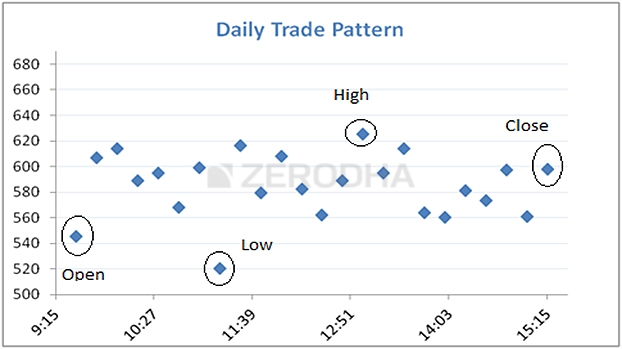
By tracking the Open, high, low and close we can draw a summary of the price action.
The open – When the markets open for trading, the first price at which a trade executes is called the opening Price.
The high – This represents the highest price at which the market participants were willing to transact for the given day.
The Low – This represents the lowest level at which the market participants were willing to transact for the given day.
The close – The Close price is the most important price because it is the final price at which the market closed for a particular period of time. The close serves as an indicator for the intraday strength. If the close is higher than the open, then it is considered a positive day else negative. Of course we will deal with this in a greater detail as we progress through the module.
The closing price also shows the market sentiment and serves as a reference point for the next day’s trading. For these reasons, closing price is more important than the Open, High or Low prices.
The open, high, low, close prices are the main data points from the technical analysis perspective. Each of these prices have to be plotted on the chart and analyzed.
Key takeaways from this chapter
- Technical Analysis is not bound by its scope. The concepts of TA can be applied across any asset class as long as it has a time series data
- TA is based on few core assumptions.
- Markets discount everything
- The how is more important than why
- Price moves in trends
- History tends to repeat itself
- A good way to summarize the daily trading action is by marking the open, high, low and close prices usually abbreviated as OHLC
Comments
Post a Comment