
Getting started
Kite is a minimalistic, intuitive, responsive, light, yet powerful web and mobile trading application offered by Zerodha. Bandwidth consumption of less than 0.5 Kbps for a full marketwatch, extensive charting with over 100 indicators and 6 chart types, advanced order types like Brackets and cover, millisecond order placements, and more. Used by over 8+ lakh clients and serving over 200 million HTTP requests a day with no hiccups.
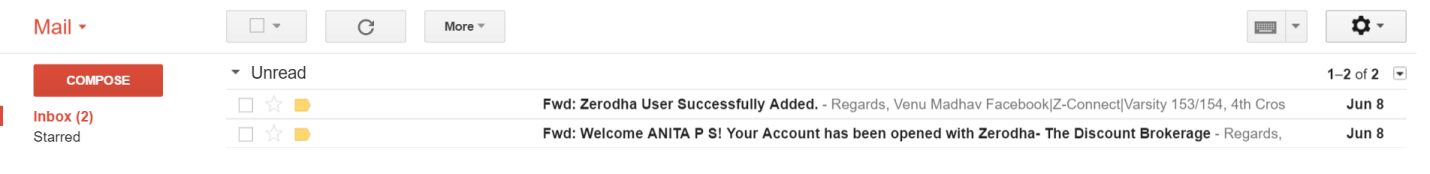
Welcome email & passwords
After account opening, two emails are sent:
- Welcome email
- Password email
Welcome email
Welcome email contains login and password details to Q, our reporting tool. Q contains all historical reports, tax P&L, ledger, fund withdrawal requests, historical holdings/positions table, trade and P&L visualizations (quant reports) to help improve trading performance and more.
Password email
This email contains the trading/Kite user ID, and the first time login password. A prompt to change this while logging into Kite for the first time will be made.
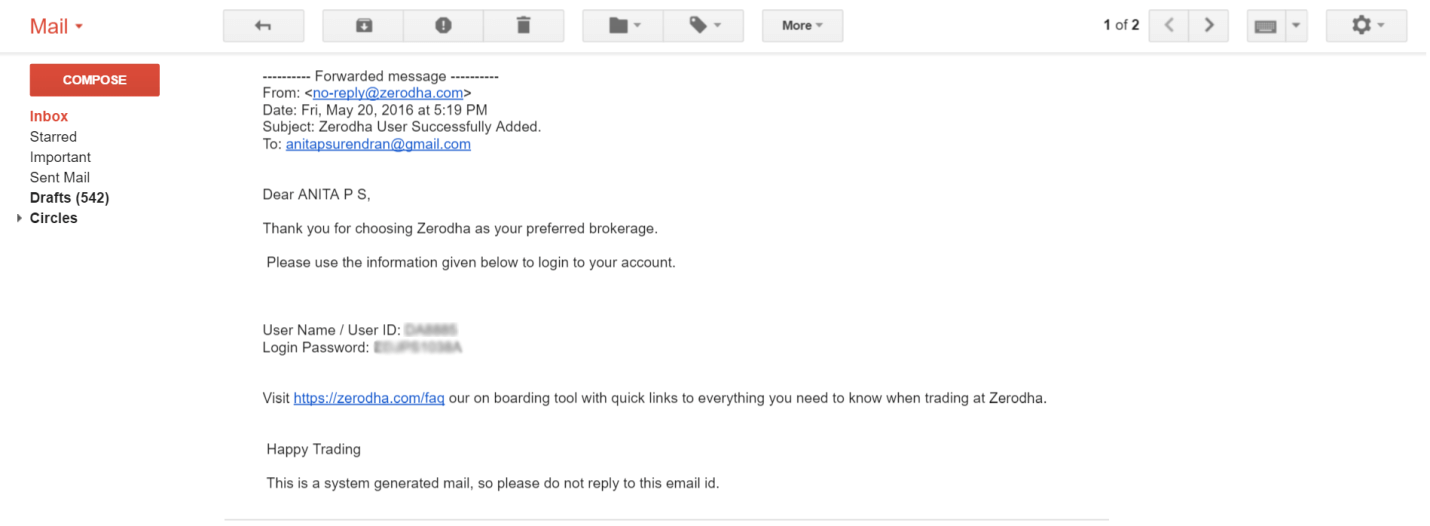
Also as part of 2fa authentication, set answers to 5 questions from a list of 10 questions. Every login thereafter would require the Kite password, and answers to any two of these five questions.
Password policy
Forgot password link under the login window on Kite can be used to reset passwords if forgotten.
If you've entered your password or 2FA answers incorrectly 10 times and you try logging in with the incorrect details for the 11th time, your account will be blocked. Once blocked, contact 080-40402020 or create a ticket to unblock.
Kite tour
When you log in to Kite for the first time you will be prompted to take a tour of the platform. You can access it again from the menu at the top right-hand corner.
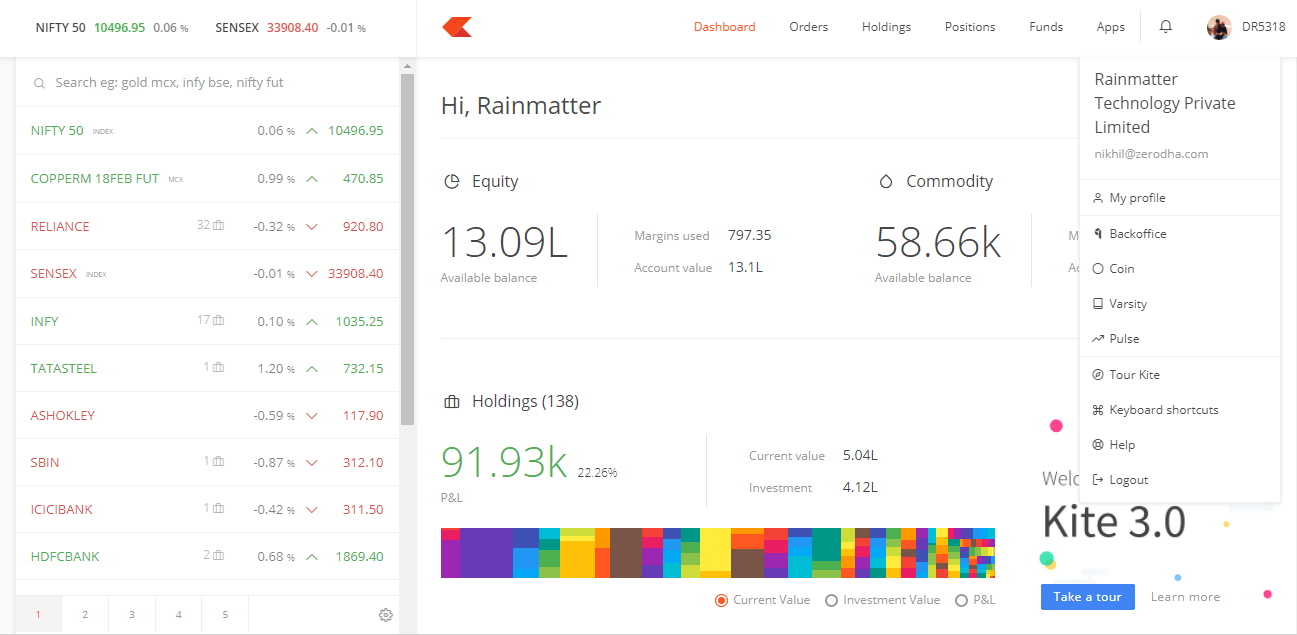
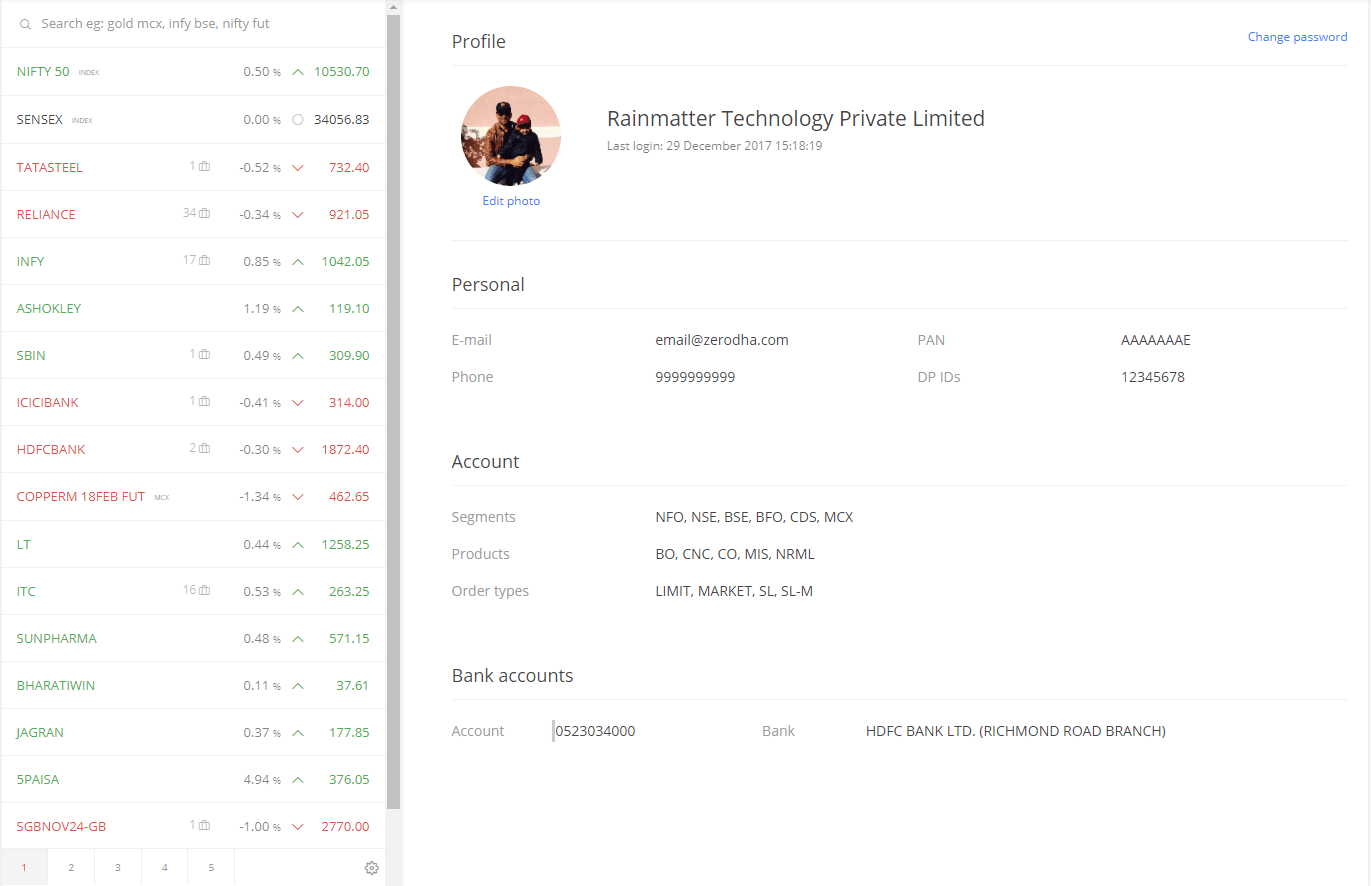
Personalize Kite
You can personalize Kite by setting your own profile picture which will show up on the login page as well. To set your profile picture, select my profile from the drop-down menu in the top right-hand corner. You can also change your password from this section.
Marketwatch
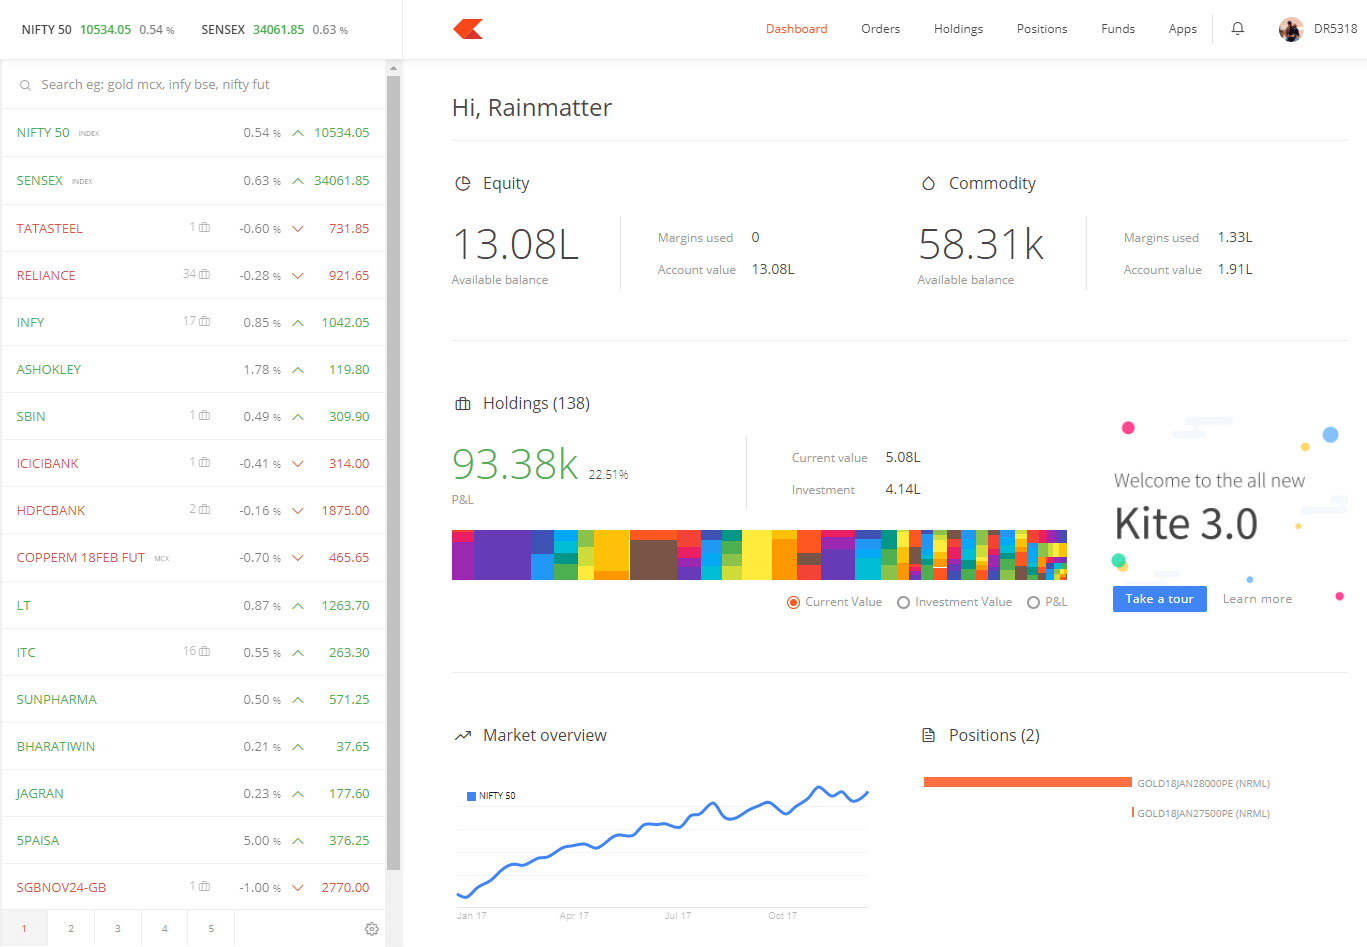
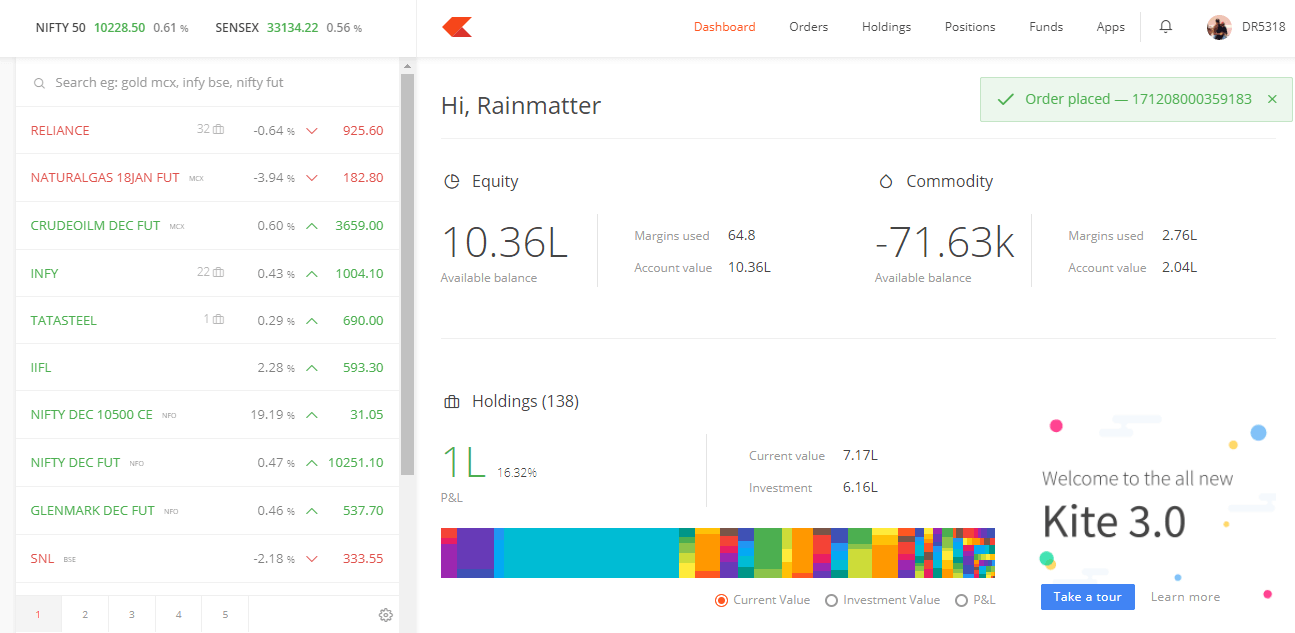
Dashboard
Shortcut key - A
Overview of the account, with a tree map visualization of stock holdings based on invested amount, current value, and P&L. Horizontal bar graph to view the most profitable and loss making positions. Mouse over visualizations to see the values.
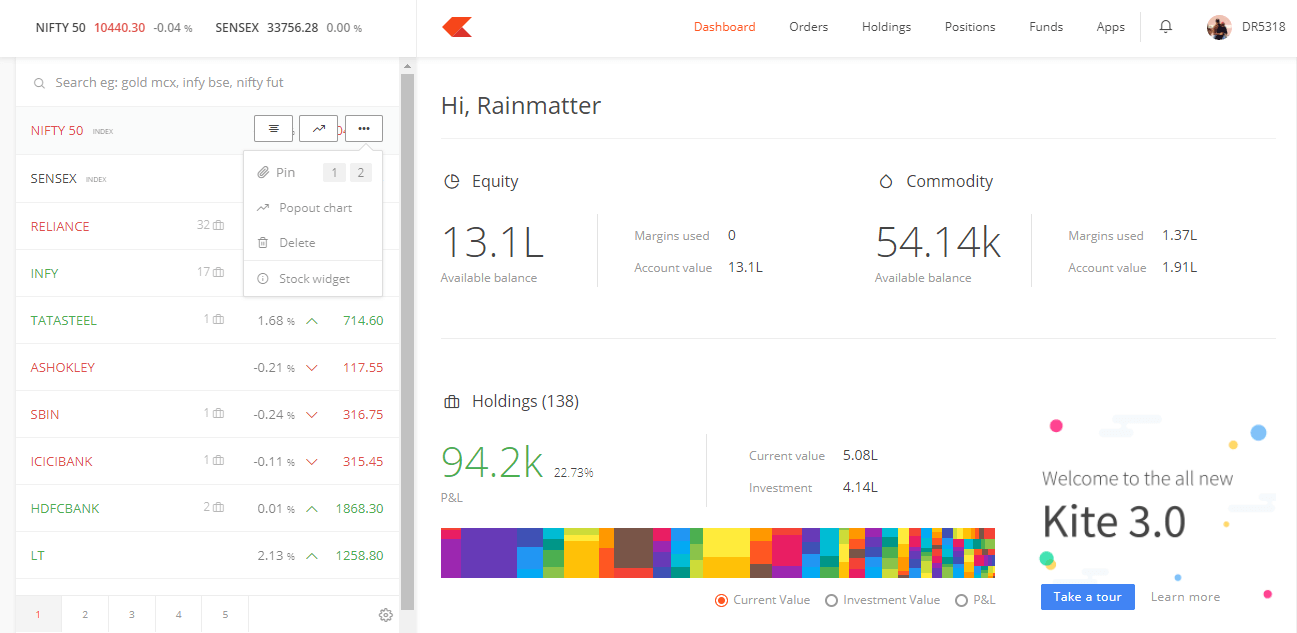
Pin stocks and indices
Pin your favourite scrips or indices globally in the top left header. Nifty and Sensex are pinned in this image.
Universal search
Shortcut key - ~
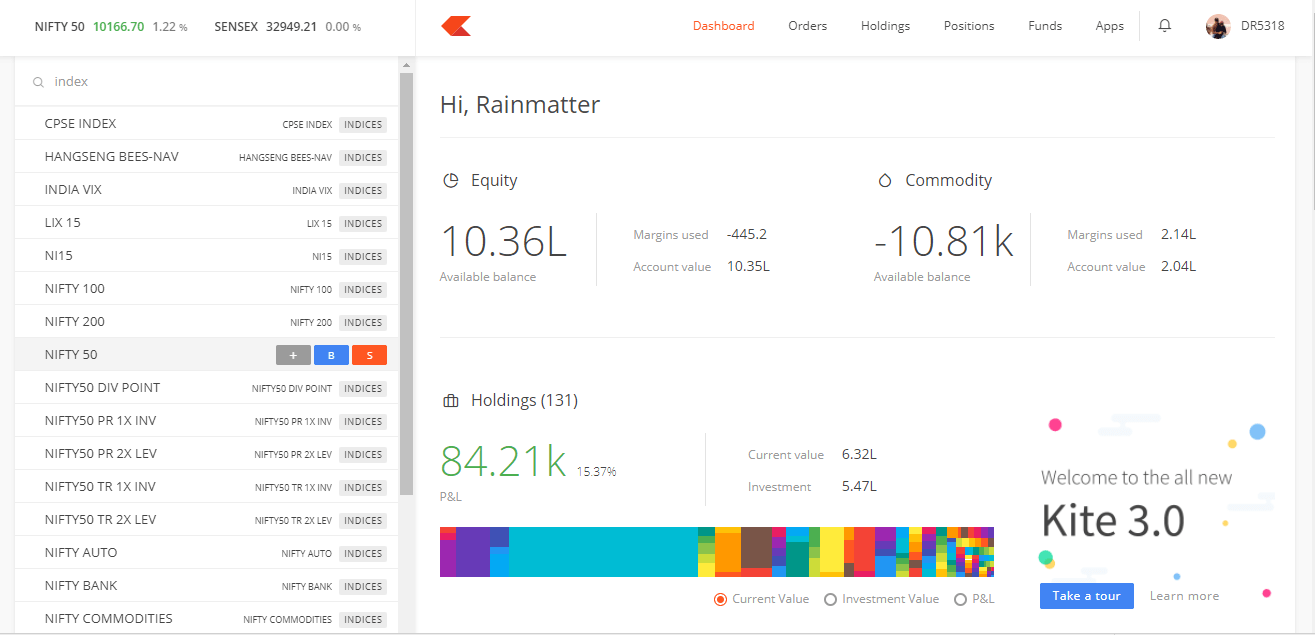
- One smart search box to instantly search tens of thousands of instruments and contracts across all segments and exchanges.
- 5 marketwatch’s numbered 1 to 5, with a limit of 40 scrips per marketwatch.
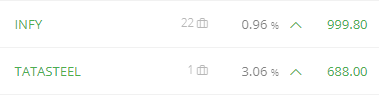
- Scripts on the marketwatch with a briefcase icon indicating the quantity of holdings or positions as shown below.
Examples to search and add scrips onto marketwatch
- To add Nifty index either search for index, or nifty 50 index, select and click on +. Similarly search for any other indices.
- To add Reliance BSE, just search for Reliance BSE.
- To add Banknifty 16th June 17000 CE (weekly option), search for Banknifty 16 June 17000 CE.
Use up and down arrow to scroll within the marketwatch. Scrips added auto saved and both Kite web & mobile marketwatch are in sync.
Shortcut key to switch marketwatch – ctrl+shift+1 (1 to 5, based on which marketwatch to switch to).
Market depth
Shortcut key – D
Mouse over the scrip on the marketwatch or select and hit D to open the market depth. Market depth gives the best 5 bids and offers. Multiple market depth windows can be opened at the same time. The dynamic market depth bars give you a visual overview of what levels most orders are being placed and you can place an order at any price in the depth with a click on it.

- Qty indicates the quantity available for buying/selling at a particular price
- Orders indicate the number of orders pending at that particular price on the exchange
- O: Open price for the day
- H: Highest price for the day
- L: Lowest price for the day
- C: Closing price of previous day
- LTT: Last Traded time
- Expiry: For Derivative contracts
- OI: Open Interest
- OI Day High
- OI Day Low
Stock widget
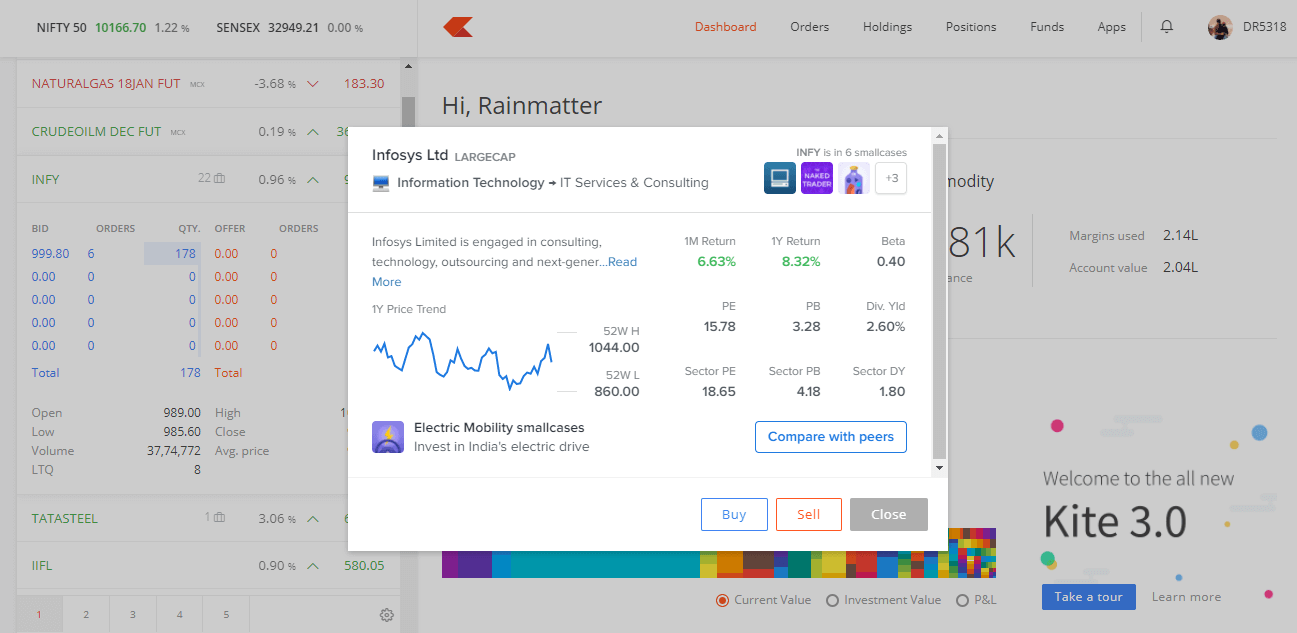
Click on the stock widget button to view a fundamental data snapshot for stocks, both in marketwatch and holdings.
Toggle - price/percentage change
Switch between seeing either absolute value of change or % change from previous day's closing price.
Funds
Shortcut key – F
Fund transfers and withdrawals can be done from within Kite under the Funds menu.
Payment gateway

Funds can be transferred instantly from within Kite using the Add funds button from over 20 different partner banks.
Choose to transfer funds either to equity or commodity account.
- Equity funds can be used for Equity, Equity derivatives, and Currency trading on NSE & BSE.
- Commodity funds can be used for trading commodity derivatives on MCX.
Money once transferred will start showing under Payin column in the funds menu for that particular day.
NEFT/RTGS/IMPS
Make sure to visit our website for all details required to transfer using any of the above methods. NEFT/RTGS/IMPS funds transfers aren’t instant. It can take anywhere between 30 mins (IMPS) to upto 10 hours (sometimes in case of NEFT) for fund update on the trading account. Read this for more.
Note
Multiple bank accounts of the trading account holder can be mapped for fund transfers either through payment gateway or NEFT/RTGS/IMPS. Courier us cancelled cheque of all the accounts that need to be mapped.
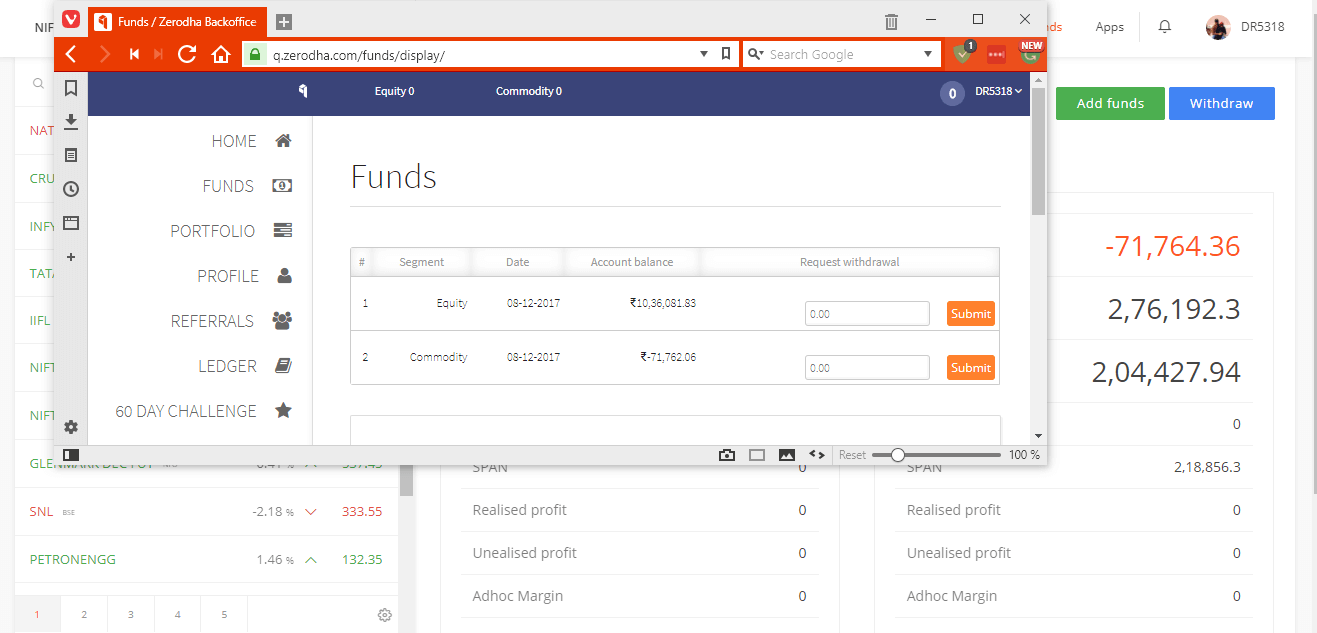
Withdrawal
Withdraw button on Kite opens the fund withdrawal request menu on Q (our reporting tool).
- Equity delivery settlement takes T+2 days in India. Cash realized from stocks sold is available under withdrawal balance after 2 trading days.
- Equity intraday and F&O settlement take T+1 day. Profit from any intraday equity or F&O trade is available under withdrawal balance from the next trading day.
Note
- All equity fund withdrawal requests are processed once every trading day at around 8.30 pm. Any request placed after is processed only the next trading day. So any withdrawal request placed on Friday after 8.30 pm will be processed only Monday which is the next trading day.
- All commodity fund withdrawal requests are processed trading days (Monday to Friday) at 9 am. All requests after that is processed only on the next trading day.
- All fund withdrawals are processed using FT/NEFT/RTGS. Ideally HDFC bank clients should receive funds same day, and all other bank clients before noon next day. Funds might take much longer to hit the bank account on days like when exchange delays in issuing trade files, special trading days, F&O expiry days, and if we have any technical issues.
- Indian banks are now closed for two Saturdays every month. Hence withdrawal requests placed on 2nd and 4th Fridays (for non-HDFC Bank account holders) will get credited only Monday morning.
- If multiple bank accounts are mapped to the trading account, all withdrawal requests will be processed only to the primary bank account mapped. To change your primary bank account, follow these steps.
Orders
Shortcut keys – B (Buy), S (Sell)
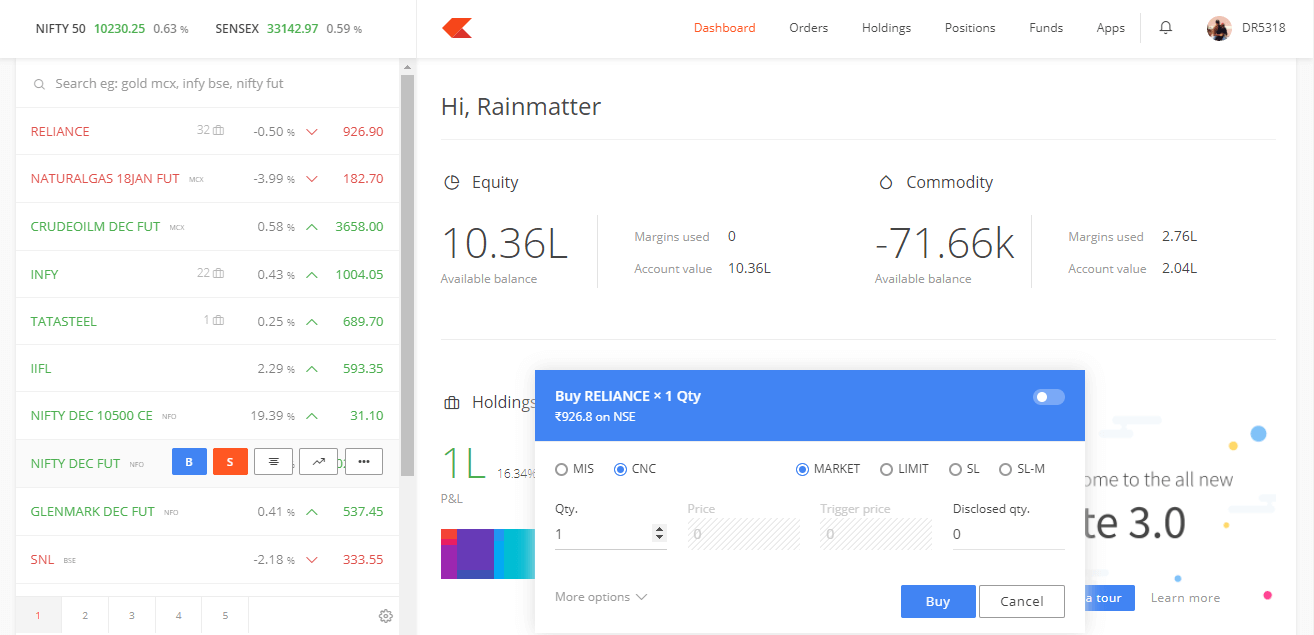
Order window
Hover over the scrip on the watchlist to initiate a Buy/Sell order window. Use shortcut keys B or S.
Floating order window
To reposition the order window, just click on it and drag it wherever you want. Kite will remember the position the next time you place an order.

Product types
CNC (Cash n Carry)
For delivery based equity trades.
To buy stocks for CNC or for delivery 100% money required. To sell stocks as CNC, stocks need to be available in holdings.
MIS (Margin intraday squareoff)
For intraday trades in equity and F&O
Trade using MIS for additional leverage/margin. All MIS positions auto-squared off 10 to 15 minutes before close of markets or when losses exceed 50% of margin (Auto-square off rule can vary based on market conditions).
- Upto 10 times intraday leverage for equity
- Upto 3 times for futures
- Upto 3 times for options shorting
- No leverage for option buying
NRML (Normal F&O trades)
For intraday/overnight F&O trades without additional leverage
Exchange stipulated margins, positions taken as NRML can be held until expiry, provided required margins maintained.
All queries on margin answered on this blogpost. To know margin requirements use our SPAN calculator.
Order types
Limit (LMT) order
Place buy or sell order at a predetermined price
Market (MKT) order
Place an order to be bought or sold at the best available price.
Note
Because of illiquidity of stock option contracts, market orders have been disabled on stock options. Only limit orders are allowed. Place a limit buying order higher than the current price or selling order below the current price, this will act as good as market order but will also protect from any impact cost due to illiquidity.
Stoploss or trigger orders (SL and SL-M)
Stoploss if placing a predetermined loss booking order at a trigger price.
Trigger if using this type of order to enter a fresh buy above the current market price or sell below the current market price when the trigger price is hit.
SL if limit order to be sent when trigger is hit. SL-M if a market order to be sent when trigger is hit.
For guaranteed execution, always use SL-M. To know more on stoploss, click here.
Placing an order
Either click on Buy/Sell or hit enter on the keyboard to place an order.
Order placed notification in a green box.
Order confirmation/rejection in the notification box.
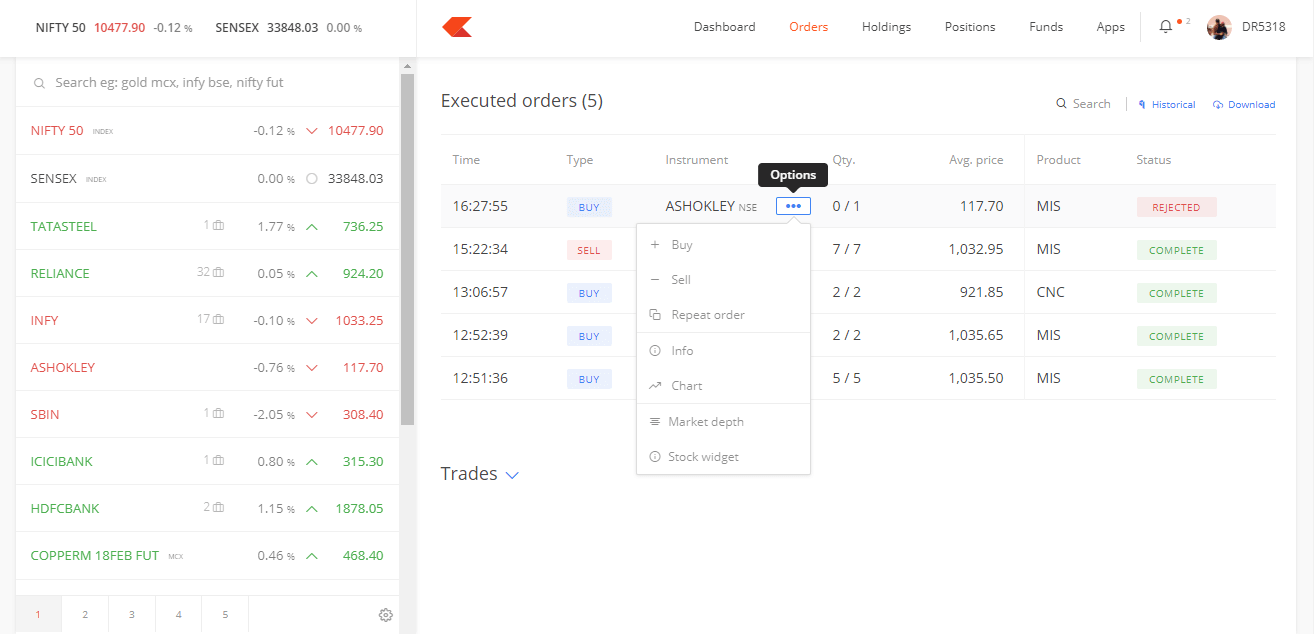
Order book
Shortcut key – O
Use the orderbook to track all open, completed, and rejected orders. Edit or cancel pending orders with mouse over as shown below.
Select the options menu and click on Info to know the order details including reasons for any rejected orders.
Click here to know what the rejection reasons mean.
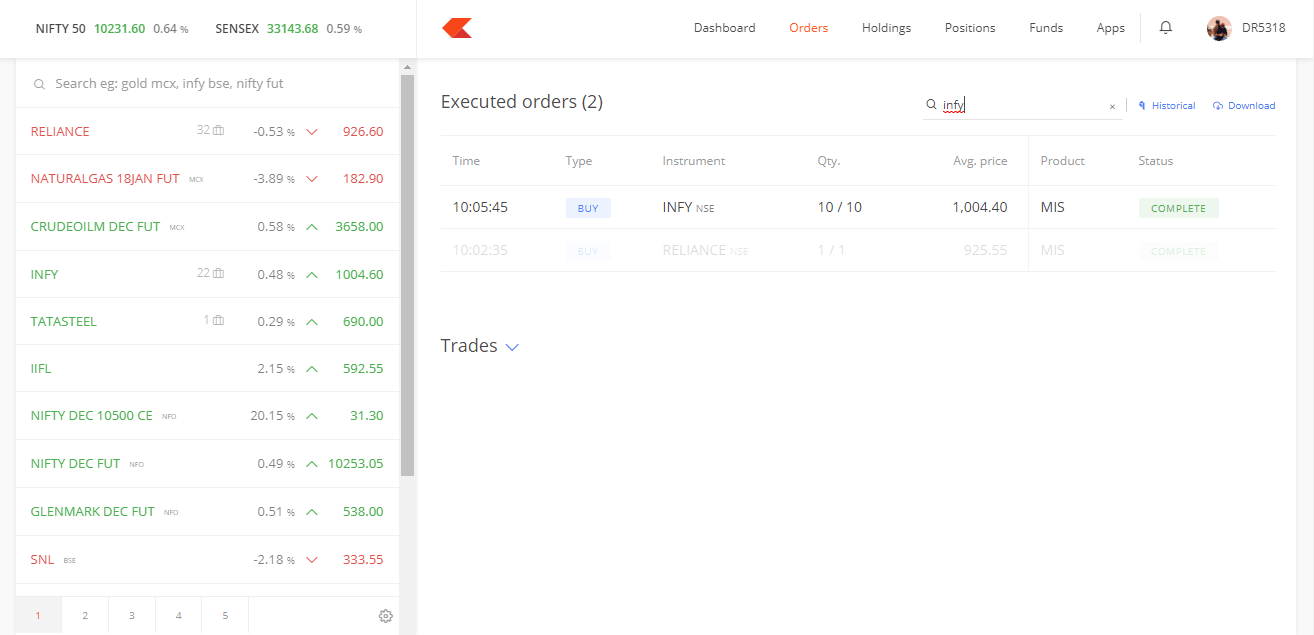
Use smart search option to quickly filter orders
Advanced order types
Click on “more options” for selecting advance order types
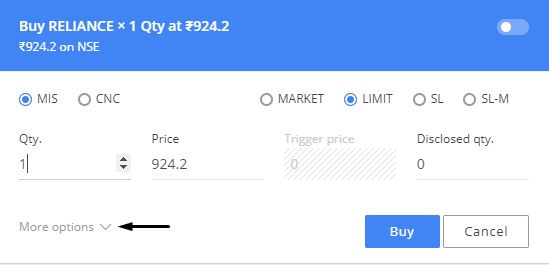
Regular orders with time validity
- Day orders for orders to be valid till end of day (selected by default)
- IOC (Immediate or cancel) for orders to be cancelled if not filled completely immediately.
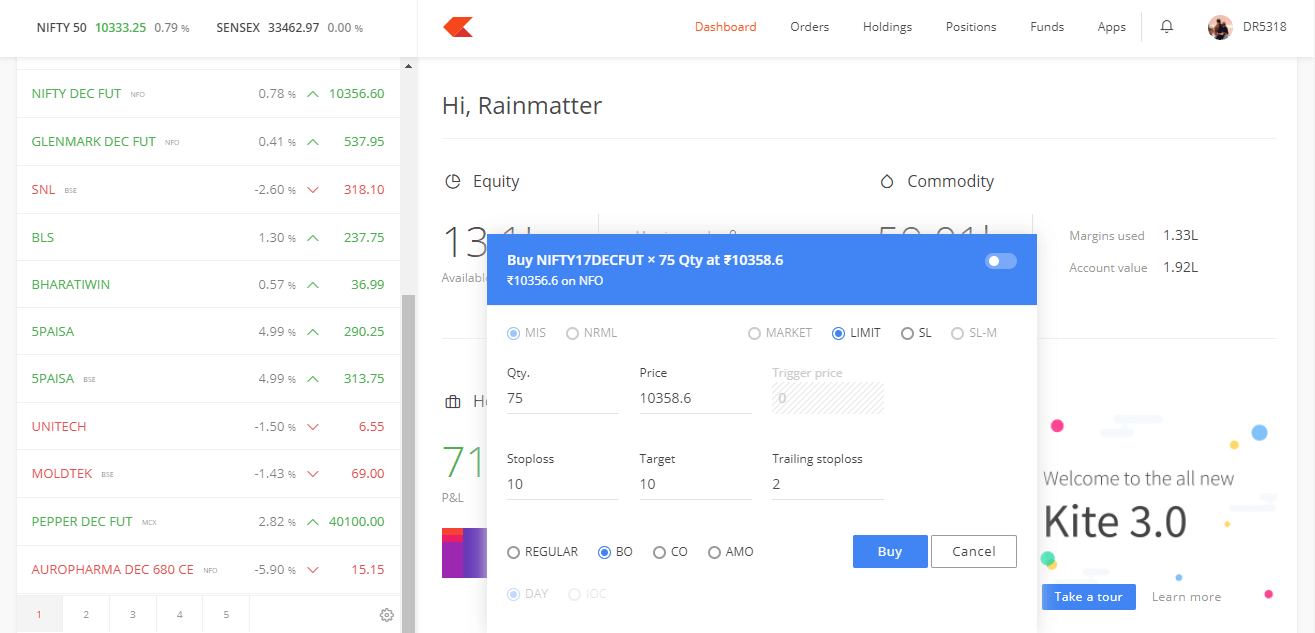
Bracket orders
Intraday limit orders (NSE, NSE F&O) with a target and stoploss and an optional trailing SL all placed simultaneously. Target, Stoploss, and Trailing SL all activated only once the original limit order executed.
SL automatically cancelled if target is met and target automatically cancelled if SL is hit. Trailing SL which is optional trails the stoploss price or moves the SL price everytime the scrip moves in a favorable direction by the trailing stoploss value mentioned.
For example, below order to buy Nifty at 8121with a 10 point SL (or 8111) and a 10 point target (or 8131). Trailing SL of 1 point, which means if Nifty goes up by 1 point to 8122, SL automatically changes from 8111 to 8112.
Bracket orders provide higher leverage because of predetermined stoploss. To know more on bracket orders, click here. Visit our bracket order margin calculator.
Bracket order with trigger entry
Enter a bracket order position using a trigger by changing the BO order type to SL. In the above example, Infy would be bought at 915 (the current market price is 912.95). This means the order would remain open until the stock reaches 915, and then execute on that trigger. This can be used to place buy bracket orders above current market price or sell bracket orders below current market price.
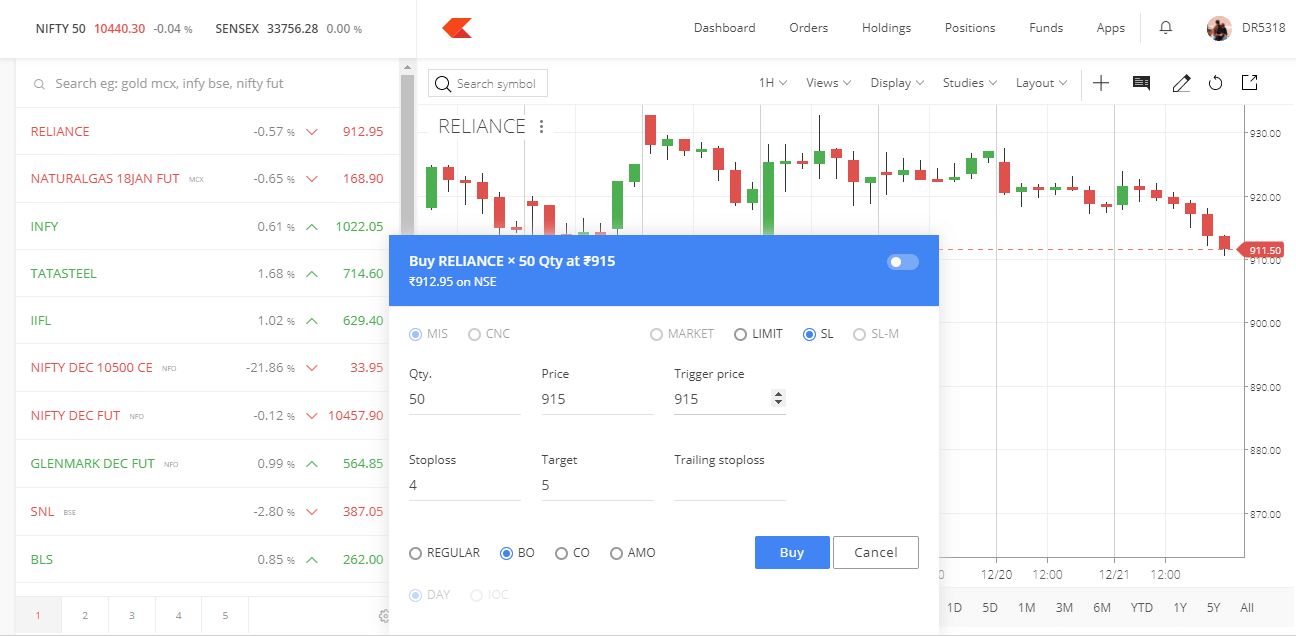
- To modify or cancel a pending bracket order, visit the order book and edit the order.
- To exit an executed bracket order, click on either the pending SL or Target order in the orderbook and click exit.
- Bracket orders (BO) valid only for intraday, all open BO positions automatically squared off normally 10 minutes before market close.
- Bracket orders can’t be converted to NRML or CNC. Exit the bracket orders and take fresh positions using NRML or CNC to carry forward positions.
Cover orders
Intraday market orders (NSE, NSE F&O, Currency, and MCX) with a predetermined stoploss order. Similar to bracket orders, higher leverage due to fixed stoploss and all positions auto-squared off before market close. Click here to know more on Cover orders, and here for cover order margin calculator.
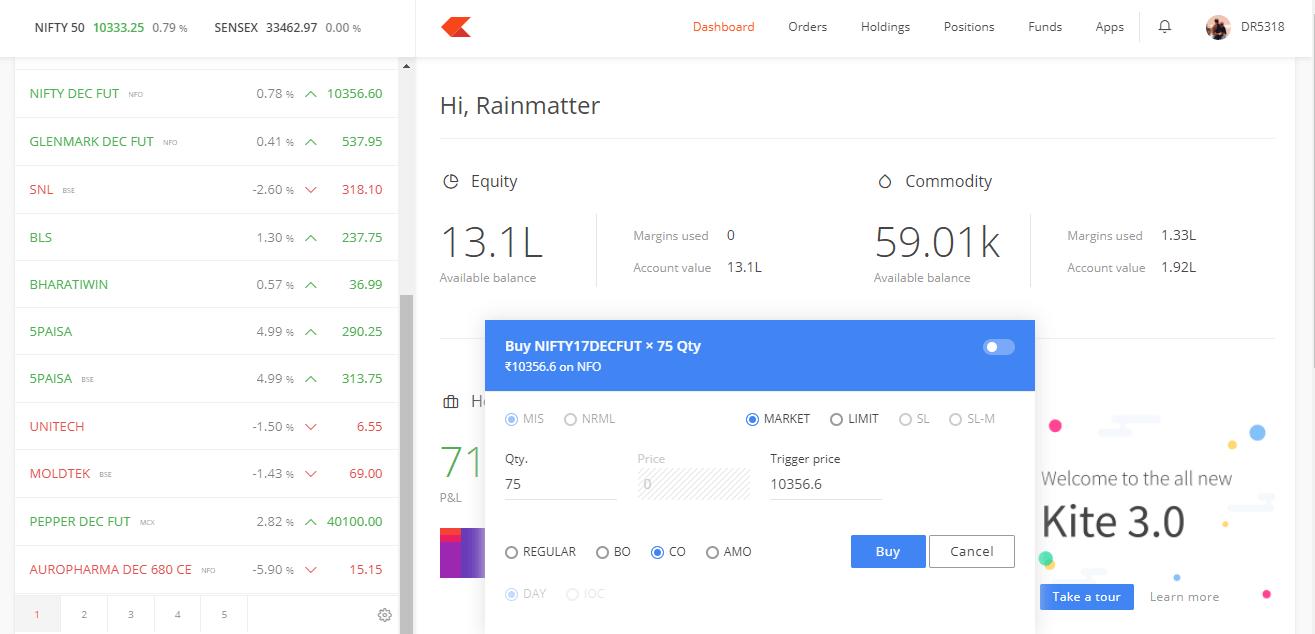
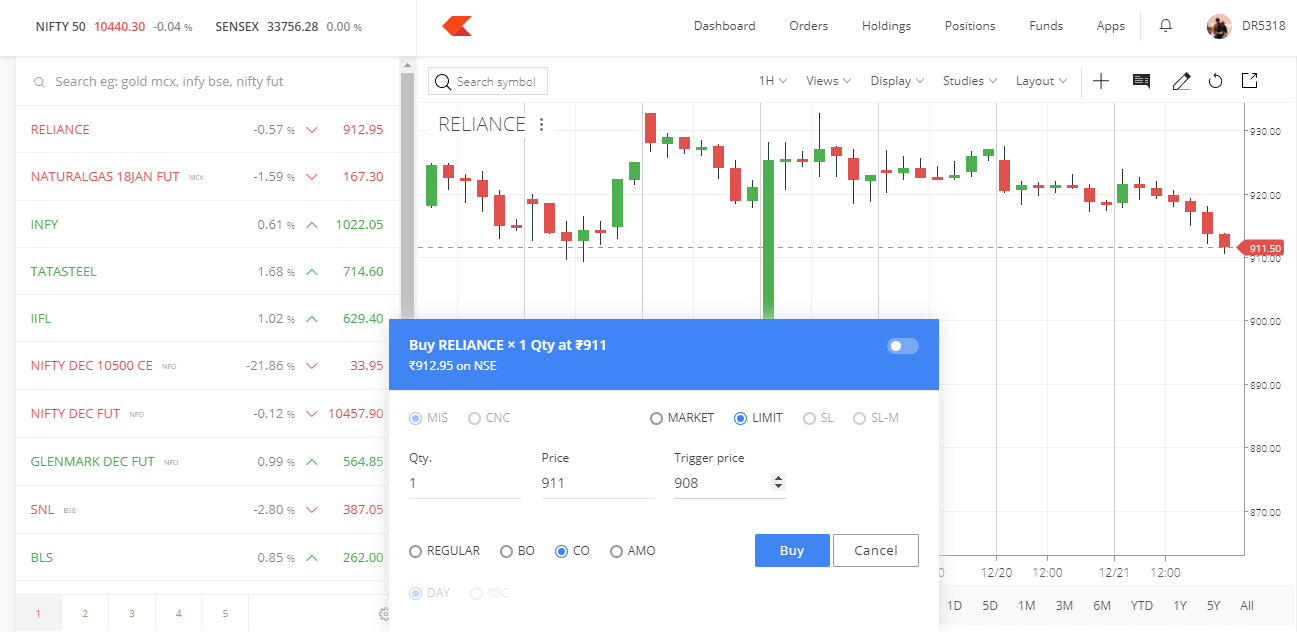
Cover order with limit entry
Enter a cover order position using a limit price by changing the CO order type to Limit. In the above example, Infy would be bought at 911 (the current market price is 912.95). This means the order would remain open until the stock reaches 911, and then execute (just like a limit order) to initiate the position. The trigger price, which defines your SL, is set at Rs. 908, so the stoploss would be placed as soon as the entry order is placed at Rs. 911.
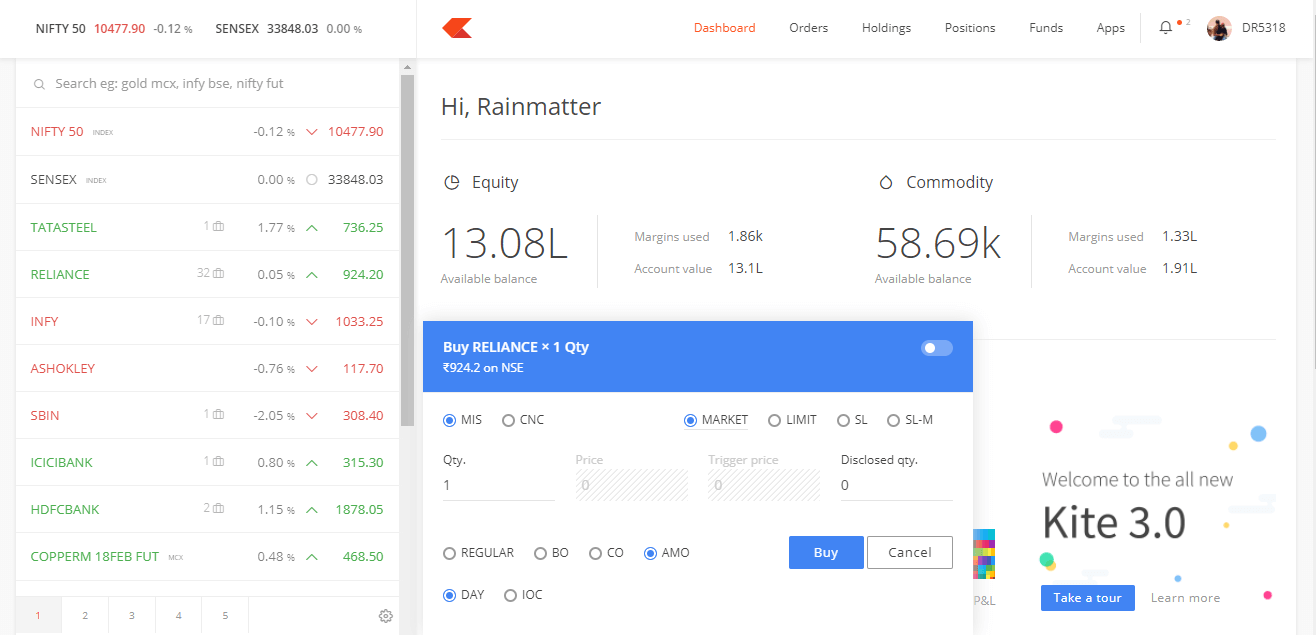
AMO (After market orders)
Place orders for the next trading day the previous day itself. AMO orders can be placed only during the following time duration –
Equity - 3:45 PM to 8:59 AM
Currency - 3:45 PM to 8:59 AM
F&O - 3:45 PM to 9:10 AM
MCX - Anytime during the day, if placed during the market hours the order will go through the next day.
Click here to know more. Only CNC/NRML/MIS orders allowed as AMO.
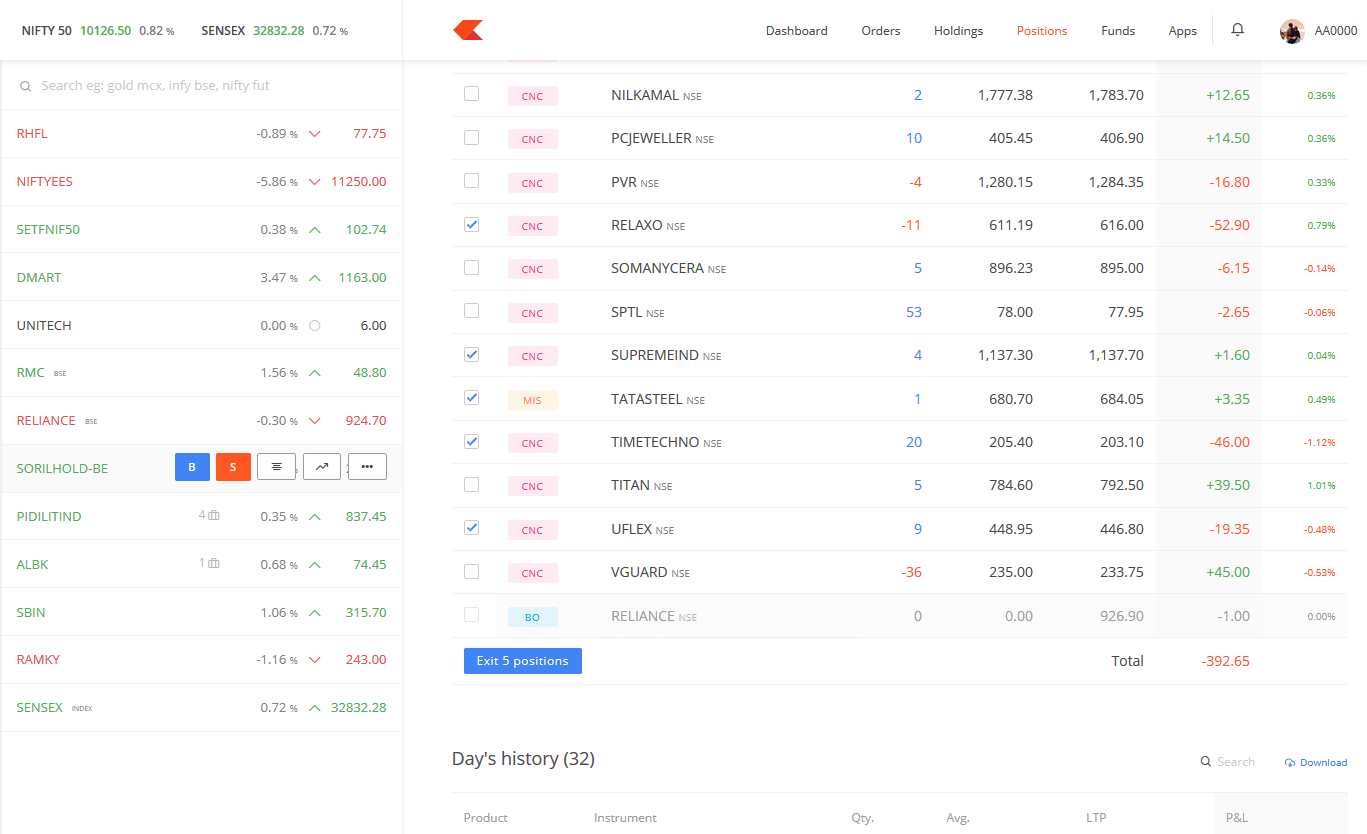
Exit multiple positions
To exit multiple open orders/positions just select them and click on exit positions. You can make use of the search to filter orders position based on instrument, order type, product etc.
Market timings
Equity
- 9 am to 9.15 am – Pre market
- 9.15 am to 3.30 pm – Normal trading
- 3.40 pm to 4.00 pm – Post market
To know more on Pre and Post market session click here.
Currency
- 9 am to 5 pm – Normal trading
Commodity
- 10 am to 11.30 pm – during day light savings time - March to November
- 10 am to 11.55 pm – November to March
Portfolio
View stock holdings and F&O positions along with average entry price and live P&L.
Holdings
Shortcut key – H
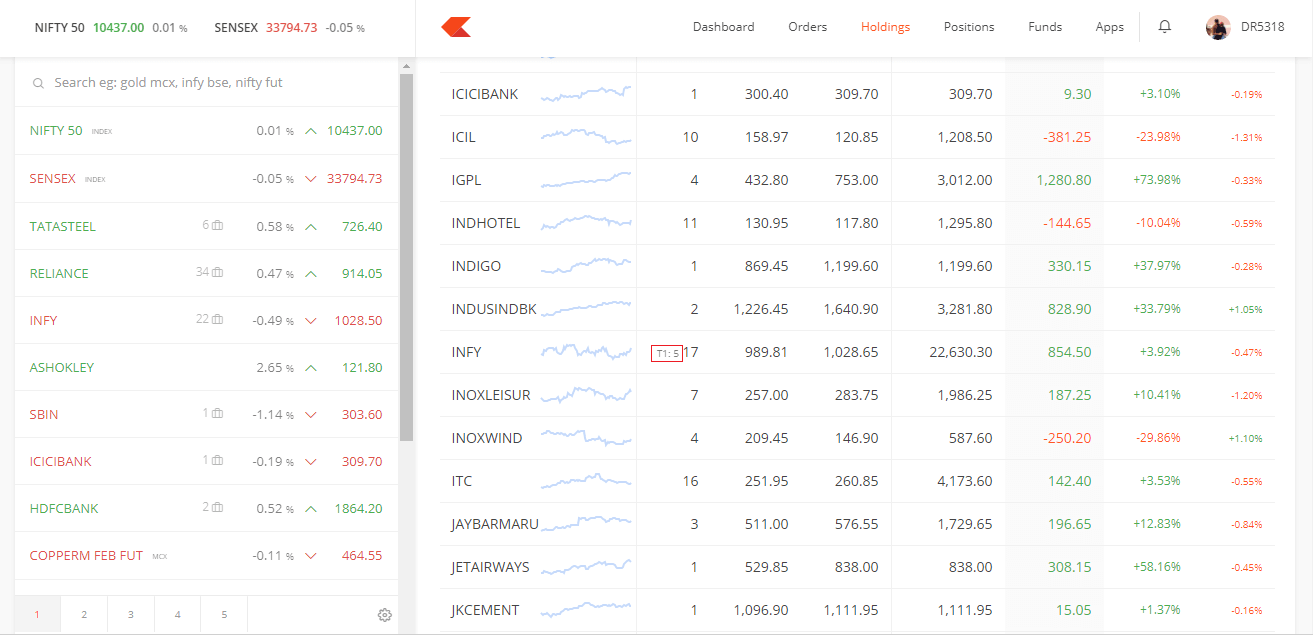
Stocks bought as CNC (equity delivery) start showing up in holdings from the next trading day (shows up in position tab on the day of purchase). But settlement cycle for stocks in India is 2 days (T+2), so stocks will be in the demat account only after two days from purchasing. Until stocks are delivered, they show up as T1 holdings (check the image below).
Read this post that explains the risk of selling stocks before taking delivery or when they are showing in T1. This is also called ATST (Acquire today sell tomorrow) or BTST (Buy today sell tomorrow). All stocks are allowed on ATST/BTST as long as they are not in the T2T/BE category set by the exchanges. Stocks in T2T/BE are allowed to be sold only once they are in the demat account.
If both holdings and T1 of a stock held. When sold, stocks which are in demat debited first.
Holdings can be downloaded as CSV/excel file. Historical link initiates Q where holdings as on a particular date can be checked. Q also gives holding period to determine long (>365 days) and short term gains for taxation purposes. If a particular stock bought in multiple trades, when selling FIFO (first in first out) method has to be followed to determine if long or short term capital gain.
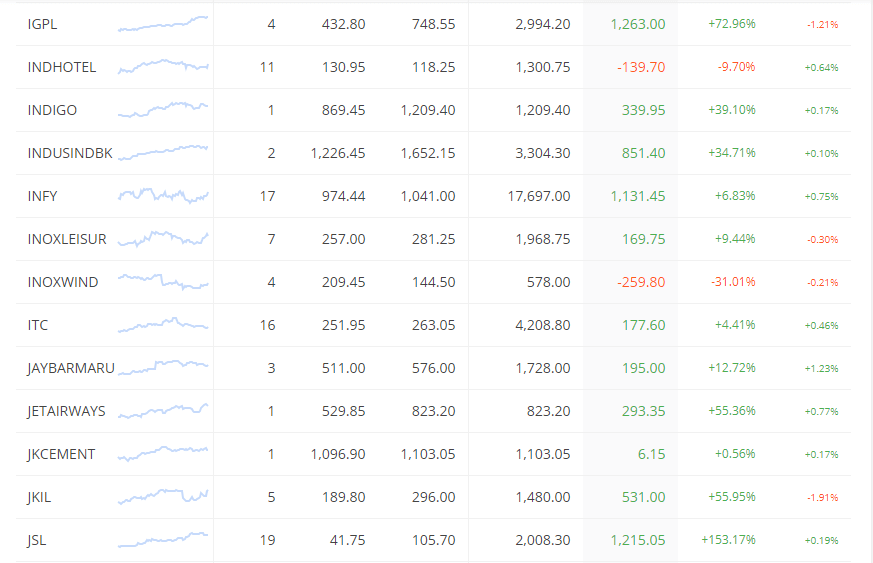
Sparklines show you a brief overview of how stocks in your holdings have performed in the last 52 weeks.
Universal context menu
You can add/exit holdings, view charts, check the market depth and the stock widget from holdings. Click on the “...” button to invoke this menu.

Exiting holdings
Exit by either of the methods below
- By initiating a sell order using product type CNC through the marketwatch.
- Mouse over on the stock in the holdings menu and using the exit button.
Note
Holdings once sold will start showing up as a negative quantity in the positions menu until end of that particular trading day. If required, this allows buying back the stock sold before the end of day treating it as an intraday trade. All such buy back within the trading day will be considered as an intraday trade when calculating STT and all other charges. The holding period will also remain un-affected. If no intent to buy back the stock after selling from holdings, disregard CNC sell in positions window on the day the stocks are sold.
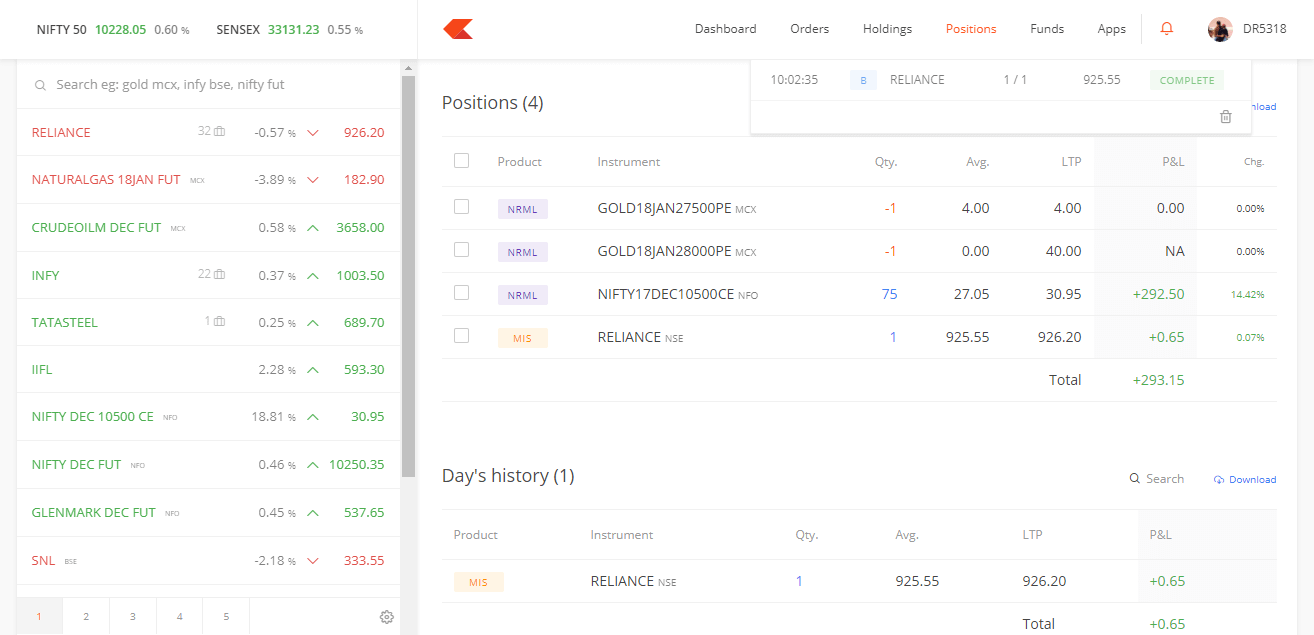
Positions
Shortcut key – P
Track, monitor, act on all F&O and intraday equity positions in a single window.
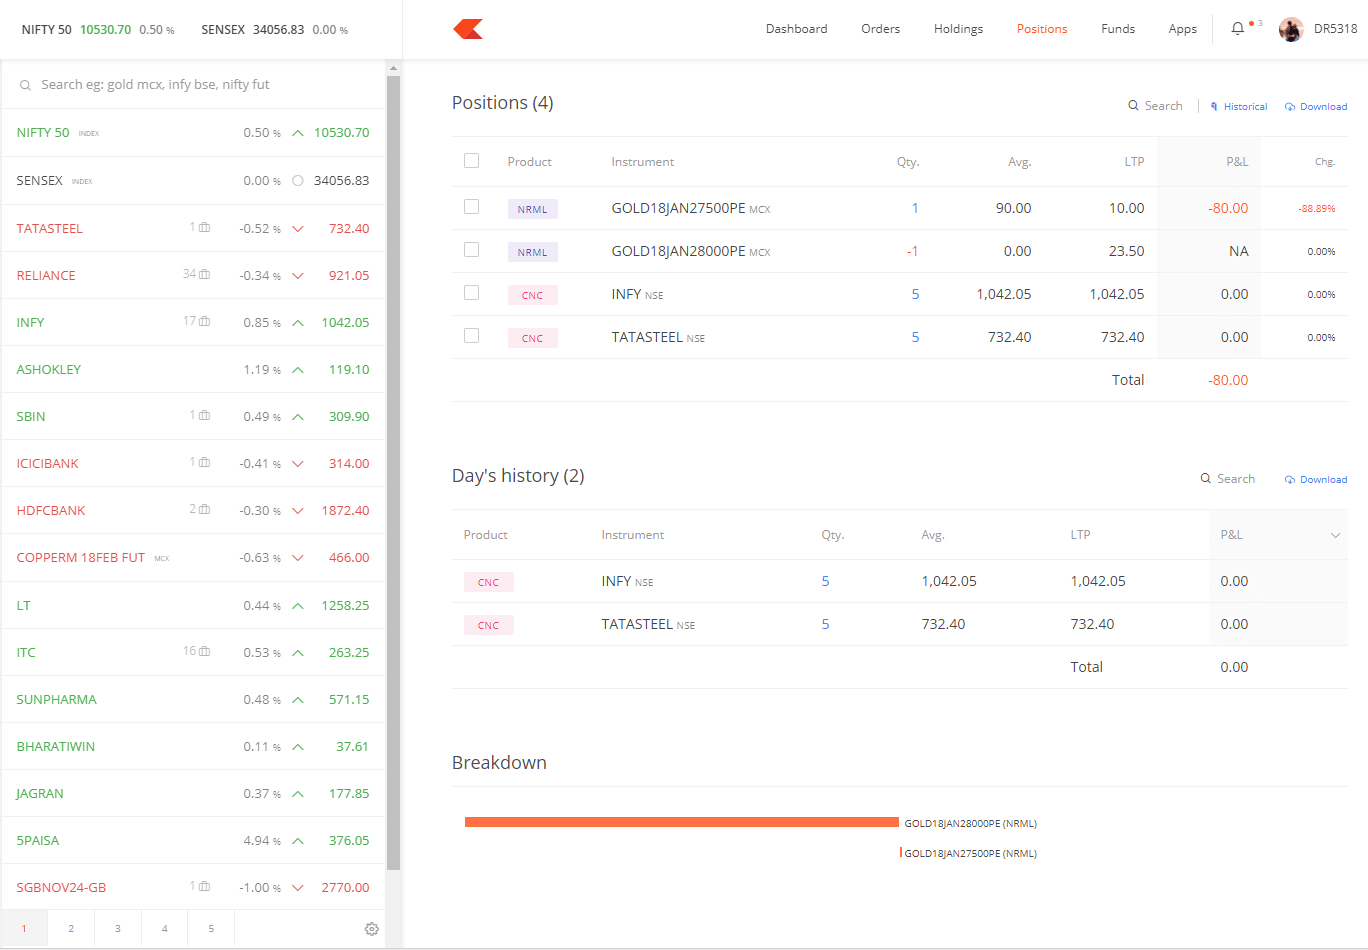
MIS (Intraday), BO (Bracket), and CO (Cover) are intraday products auto-squared off before end of day. Check this post for our margin policy.
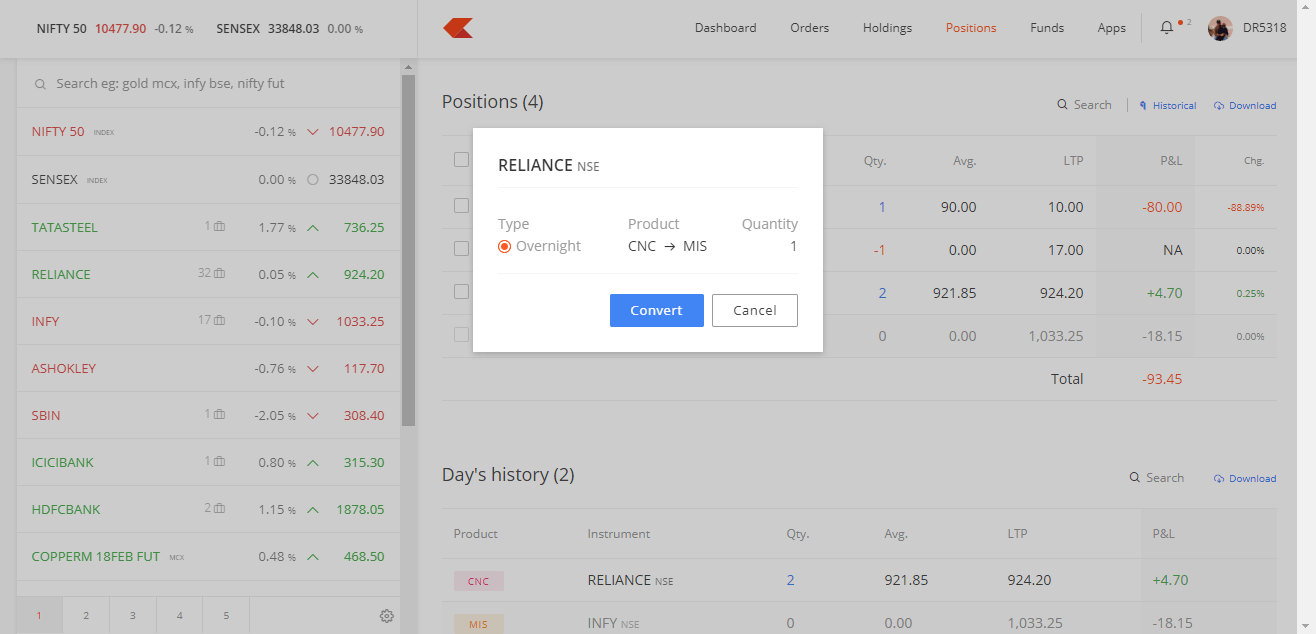
Position conversion
- MIS (Intraday positions) can be converted to NRML/CNC (Overnight/delivery) by clicking on “>”
- Brackets and covers can’t be converted using position conversion to CNC/NRML. BO/CO positions can be exited and new CNC/NRML positions can be taken to carry forward to the next day.
Exiting positions
Exit by either of the methods below
- Place an opposite order for the position held. Ensure while placing an opposite order that same product type is used. So for example positions bought as NRML needs to be exited as NRML. If by mistake entered as MIS, it would get considered as two separate positions.
- Mouse hover on the positions or click on the > as shown in the image above.
harting
Over 100 indicators, 6 different chart types, 19 drawing tools, and popout as many charts at a time. Set chart templates, intraday data from 2014 and daily charts for over 7 years for stocks, commodities, F&O, and currencies.
Initiating charts
Shortcut key – C
Mouse over on marketwatch or use shortcut key “C” to initiate charts.

Trade from charts
Click the lightning bolt icon on the top left corner to invoke the quick trade panel. You can check the real-time market depth, positions and open orders from the panel. To trade, you can click on the buy & sell buttons. You can also place orders directly from the market depth by clicking on a bid or an offer.

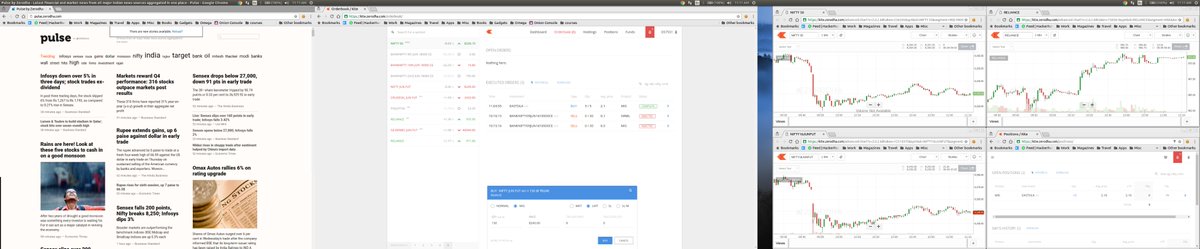
Trading screen
Popout as many charts as needed. Open new tabs by right clicking on dashboard, orderbook, holdings, positions, funds and arrange the trading screen. Experience much better with multi-monitor setups, check the image below simultaneously tracking 4 charts, positions, and news from pulse.
Changing timeframes
By default 1 min charts open up, which can be changed to any other default timeframe.
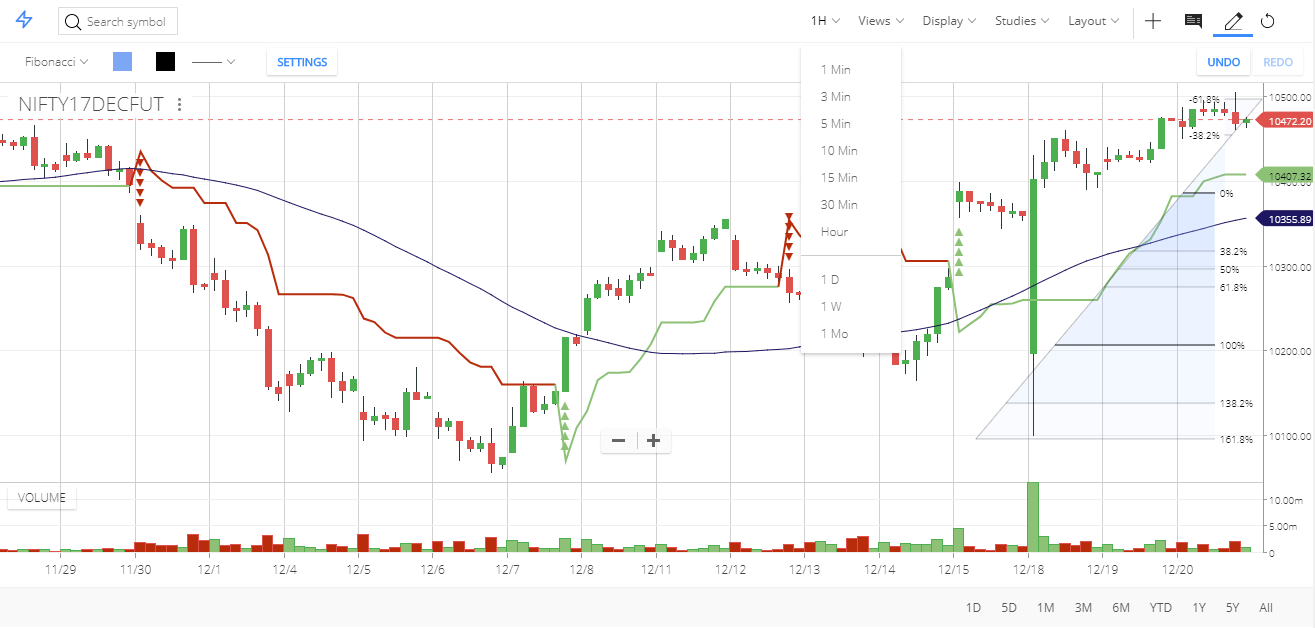
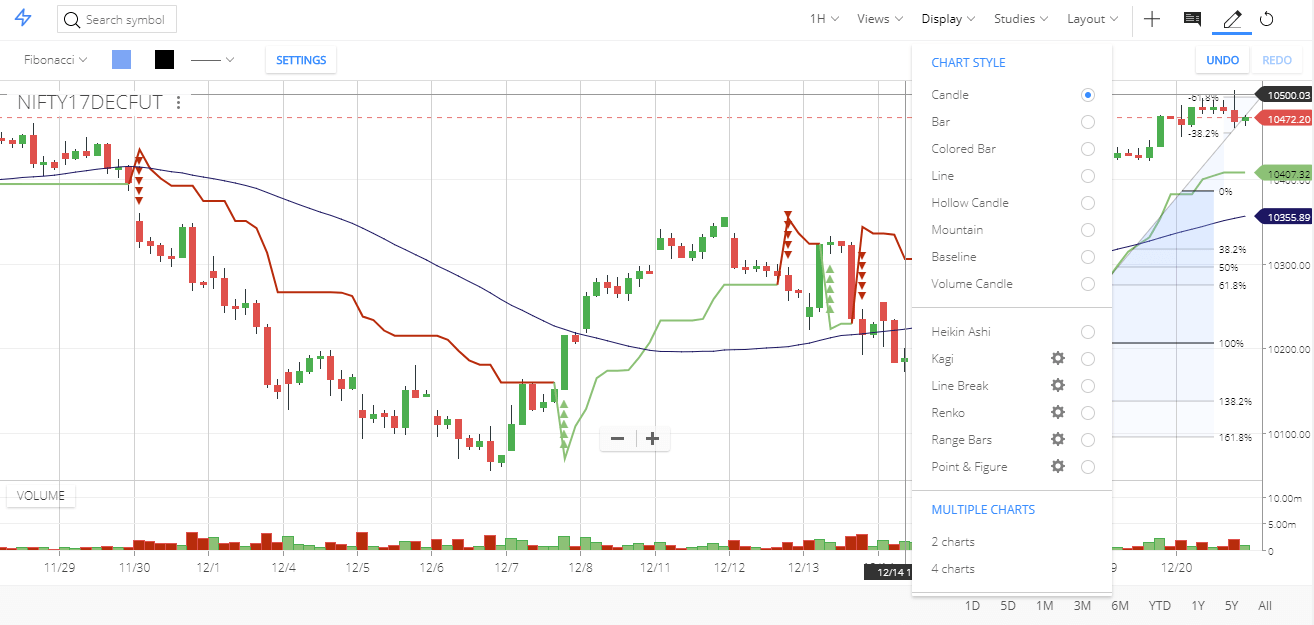
Chart types
Indicators/Studies
Click on studies to add indicators on the chart. Either search for the indicator or click on show all to see the entire list.
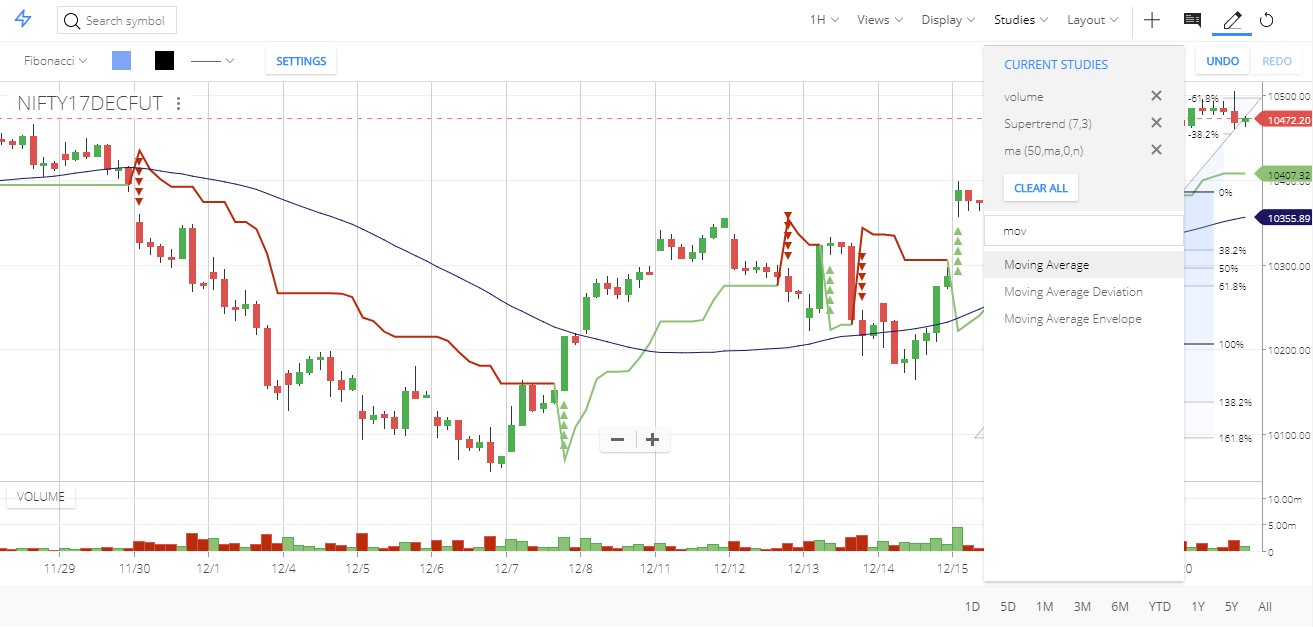
Note
To add an exponential moving average, select moving average in studies, and in the type dropdown select exponential from the list of 9 different moving averages.
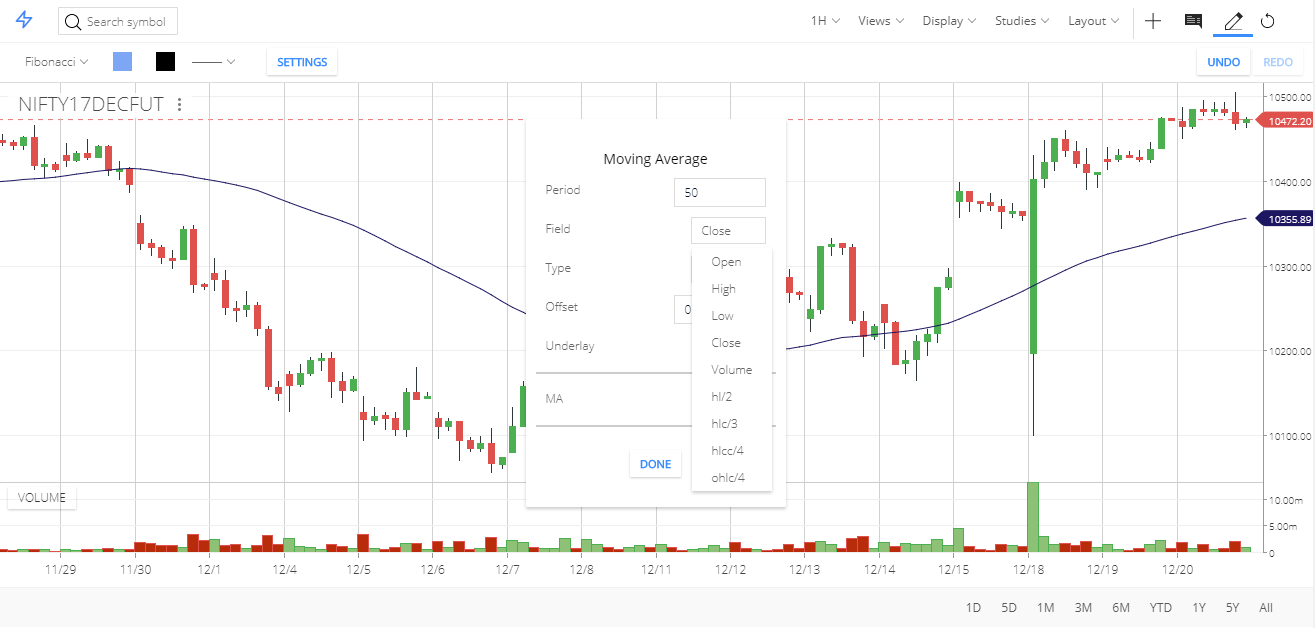
Adding studies on different data sets
By default indicators are applied on closing price of the candle. This could be changed to open, high, low, and even over another indicator that is already added on the chart.
Check this module on varsity on using some very popular studies available on Kite.
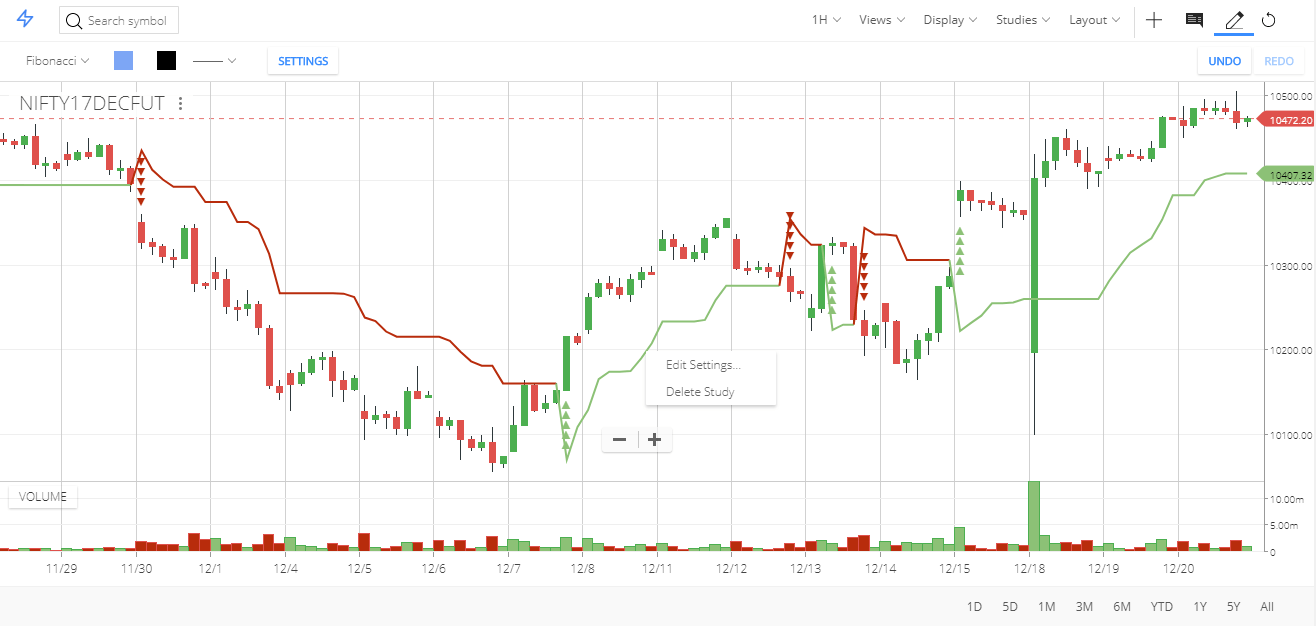
Deleting studies
Right click the study on the chart to delete as shown below.
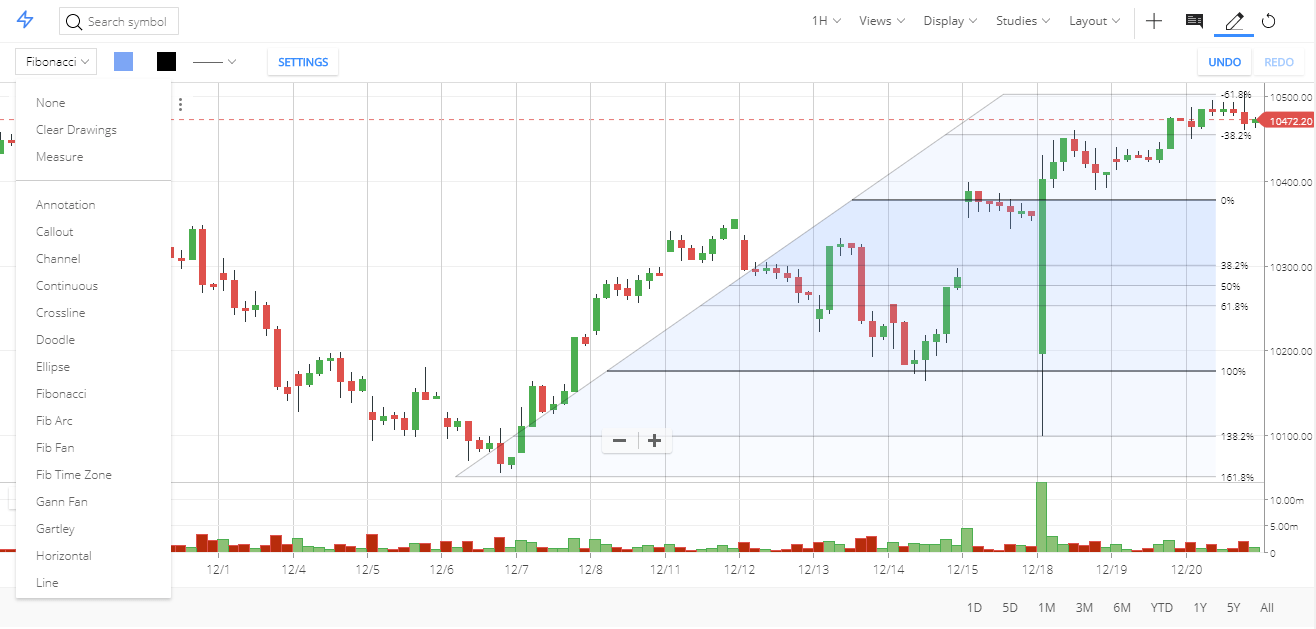
Drawing tools
Select from over 20 different drawing tools. Use the settings to customize the drawing tool.
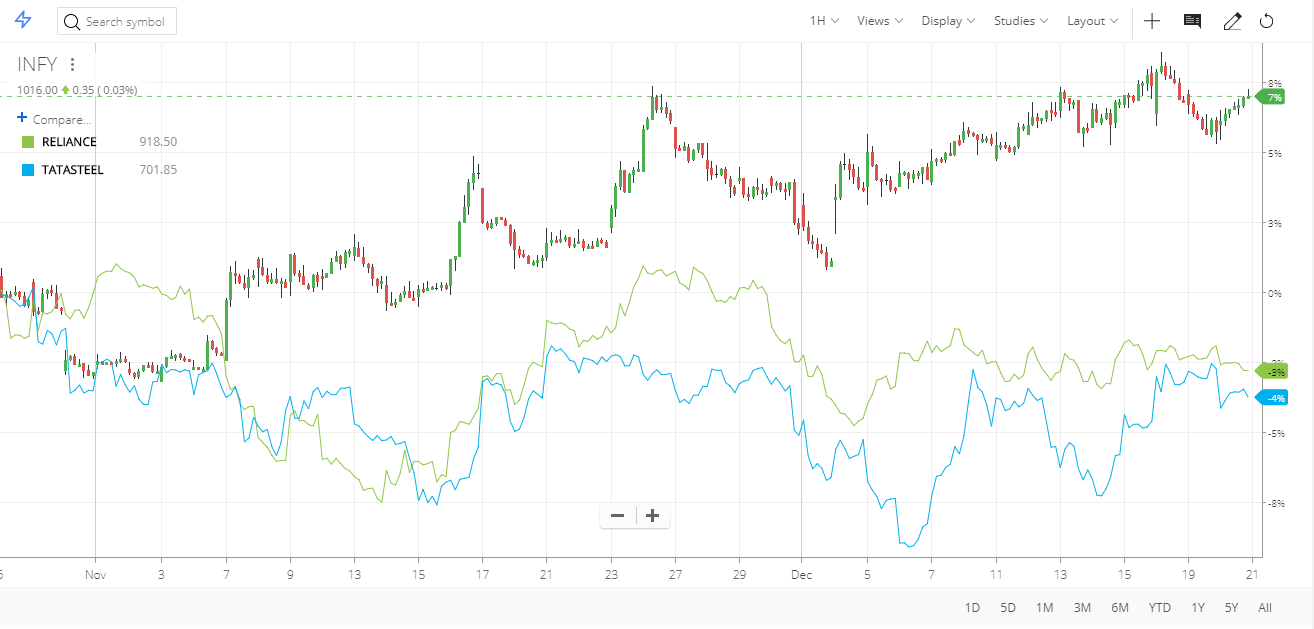
Compare scrips
Click on compare to visualize relative performance of different scrips on the chart. No live ticks when using this utility.
Multi-view chart
With multi-view charts, you can view up to 4 charts simultaneously in the same window. Click on display in the charting window and select 2 or 4 charts from the dropdown. A new window will open with the multi-view chart.

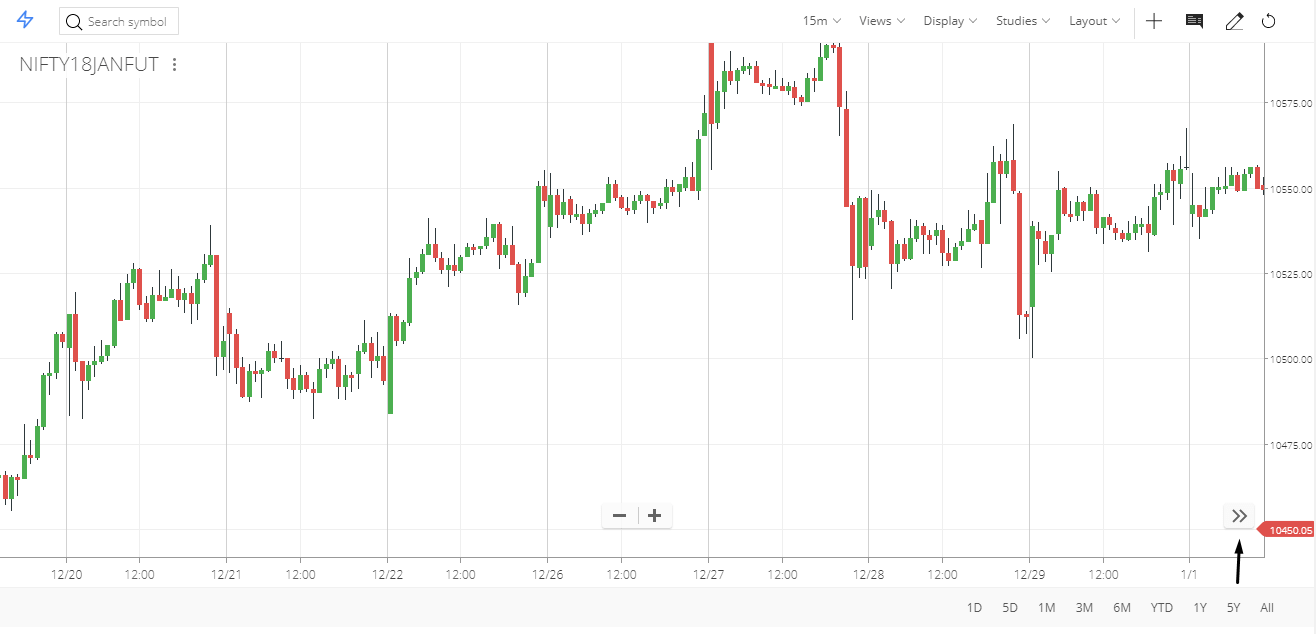
More data
On complete zoom-out, 700 to 2500 bars can be viewed at a time based on the size of the monitor. To load more data drag the chart to the right, every drag will load more historical data. Use the left and right arrow keys to move, and use up and down arrows for zooming in and out.
On loading a lot of candles, to get to the current candle use the “>>” button as shown below
Chrome extension
Access your Kite account from any website with just a single click on the extension. Click anywhere outside to hide the Kite popup. The extension can be installed from this page.

Once added, the extension will start showing up on your Chrome browser.
 .
.
Once the extension is installed, Kite buy and sell buttons will be visible next to NSE equity scrips on popular websites like Yahoo Finance, Google Finance, etc., to help you place your orders.
Kite mobile


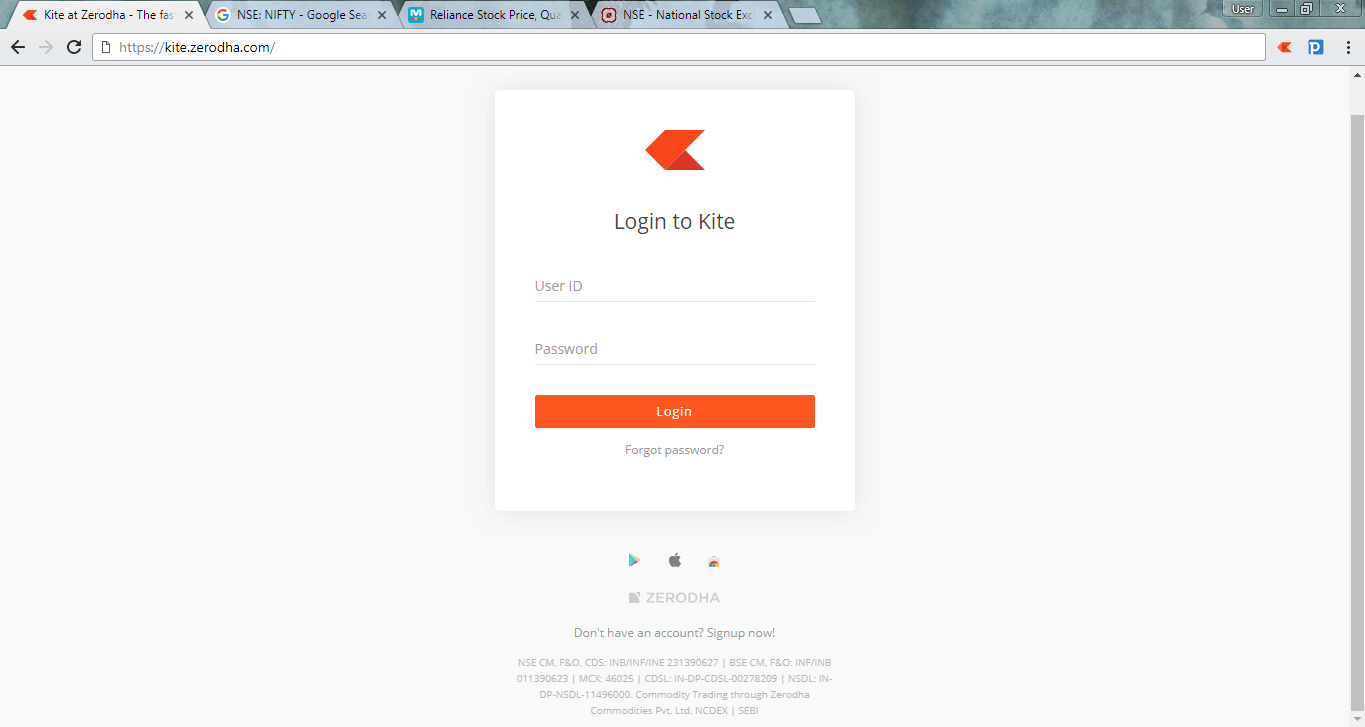
Login
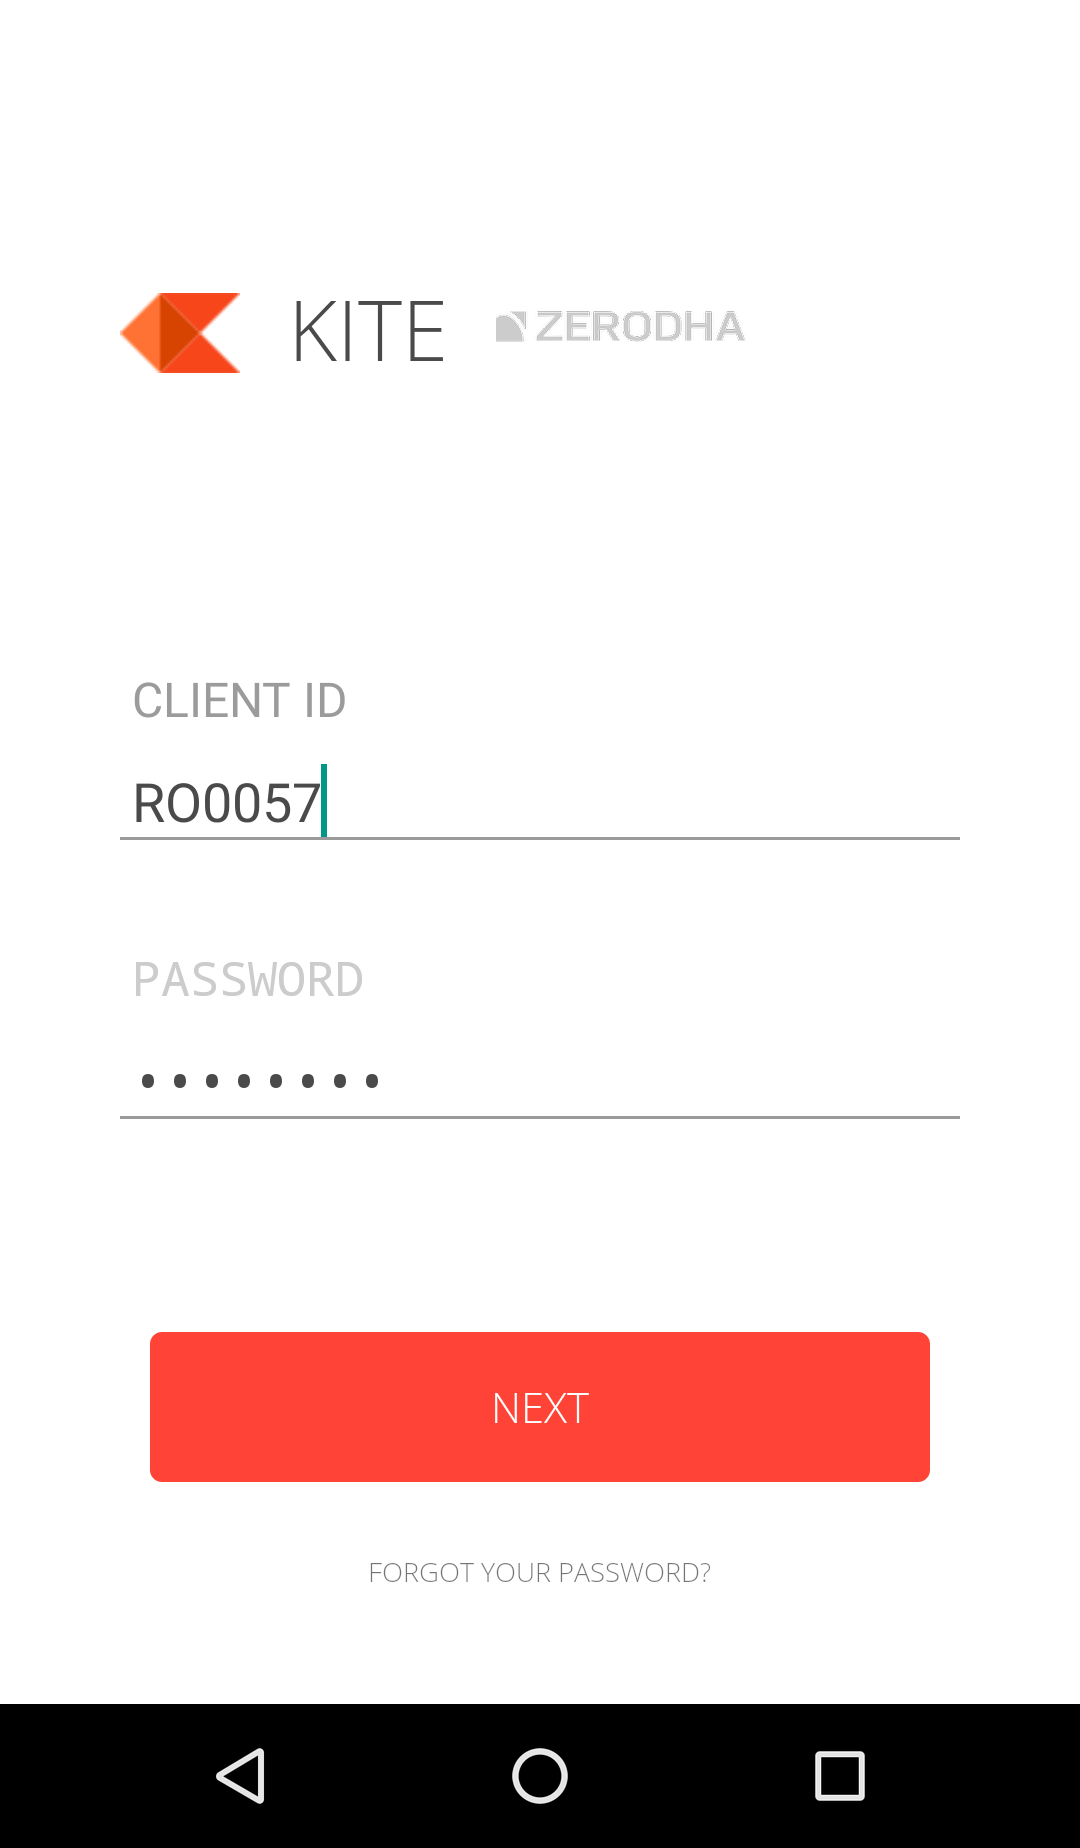
Enter client ID and password.
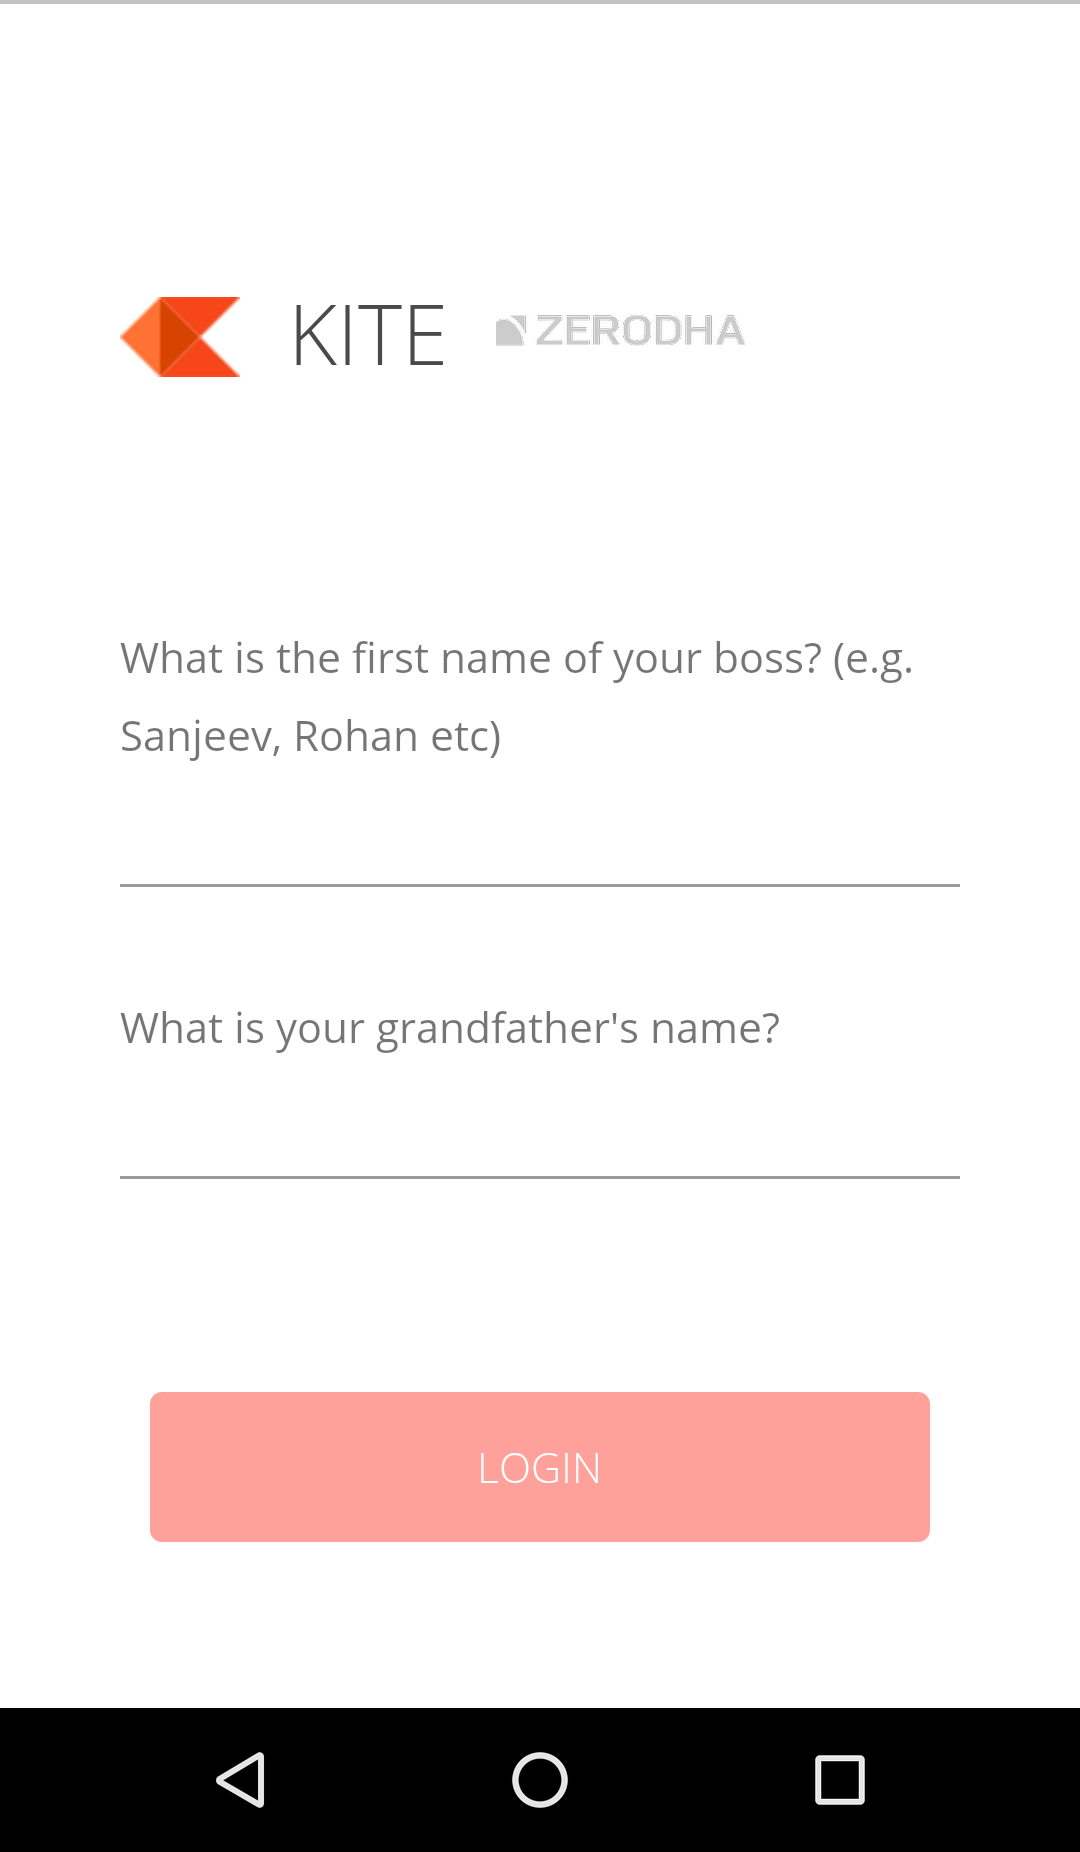
Answer 2FA questions.
Marketwatch
Adding scrips

To add scrips, type the name of the scrip in the universal search bar and add by clicking on the desired result.
Examples to search and add scrips onto marketwatch
- To add Nifty index either search for index, or nifty 50 index, select and click on +. Similarly search for any other indices.
- To add Reliance BSE, just search for Reliance BSE.
- To add Banknifty 16th June 17000 CE (weekly option), search for Banknifty 16 June 17000 CE.
Deleting scrips
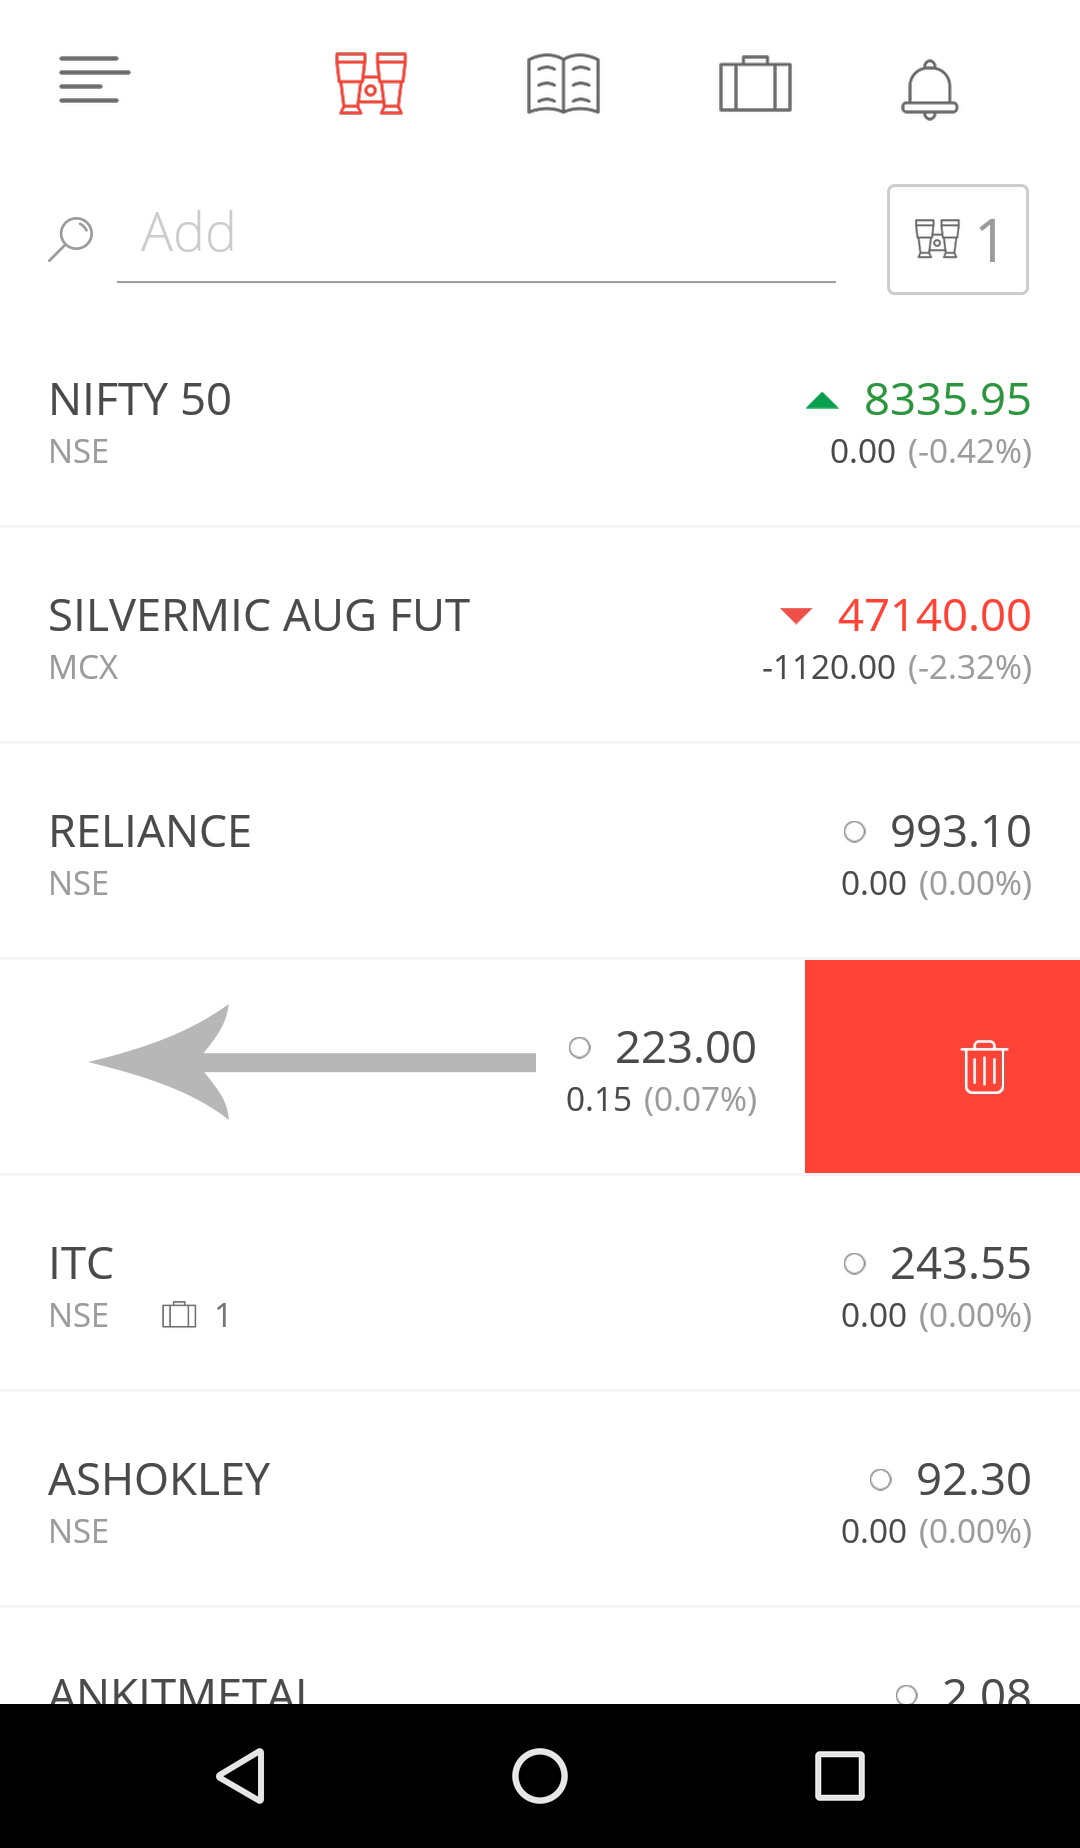

Android users: Delete scrips by swiping left on the marketwatch.
iOS users: Long press on the scrip and tap the delete icon next to it to delete from marketwatch.
Rearrange marketwatch

Long press on the marketwatch to enter the rearrange view. Rearrange scrips on this screen by dragging scrips to the desired position using the icon on the right.
Switching marketwatch

Kite allows upto 5 marketwatch, each with a maximum of 20 scrips. To switch, click on the marketwatch icon as shown above.
Market depth

Click on the scrip to invoke action menu. Invoke market depth by clicking on the “Depth” button.
Funds
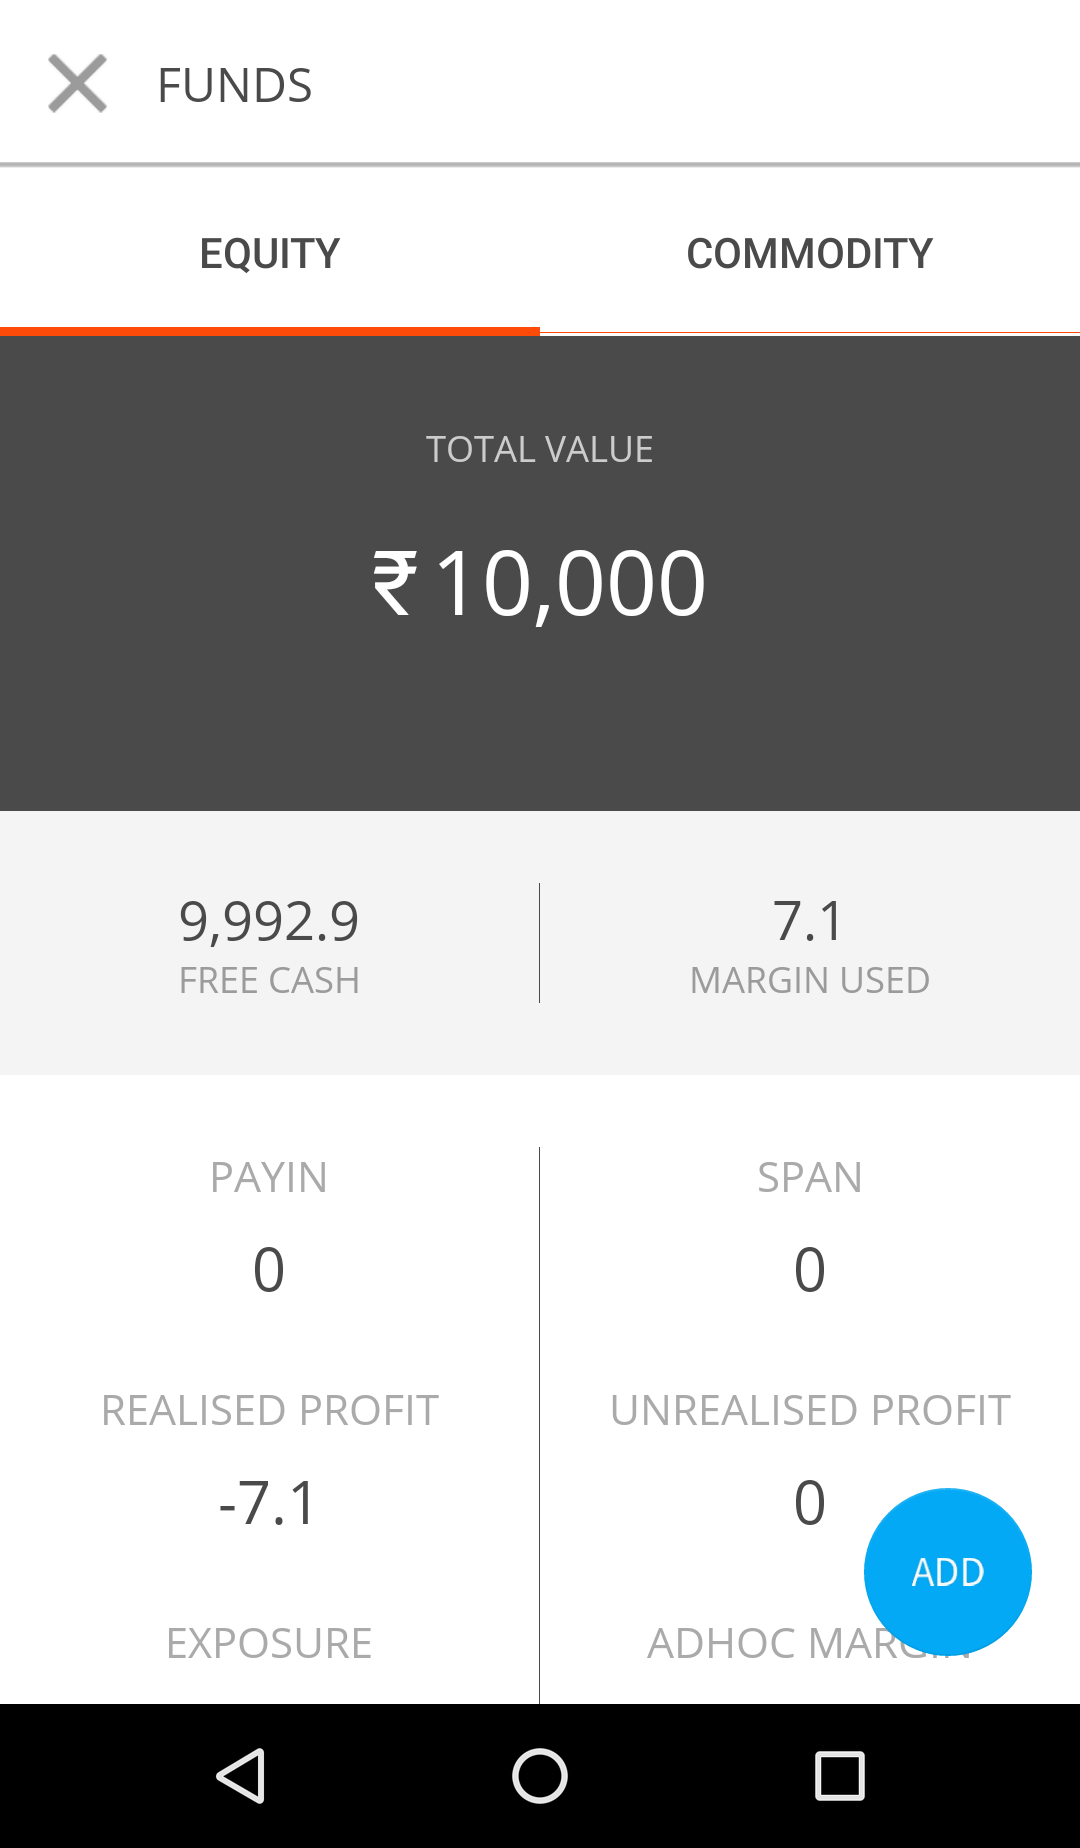
Access the funds page from the navigation drawer by clicking on “Funds”. View available account balance, used margin, exposure margin, and more. Add more funds by clicking on “Add”.
Order window

Invoke order window by clicking B or S.
Click here to learn more on order types.
Click on Advanced to initiate Bracket, Cover, and AMO orders.
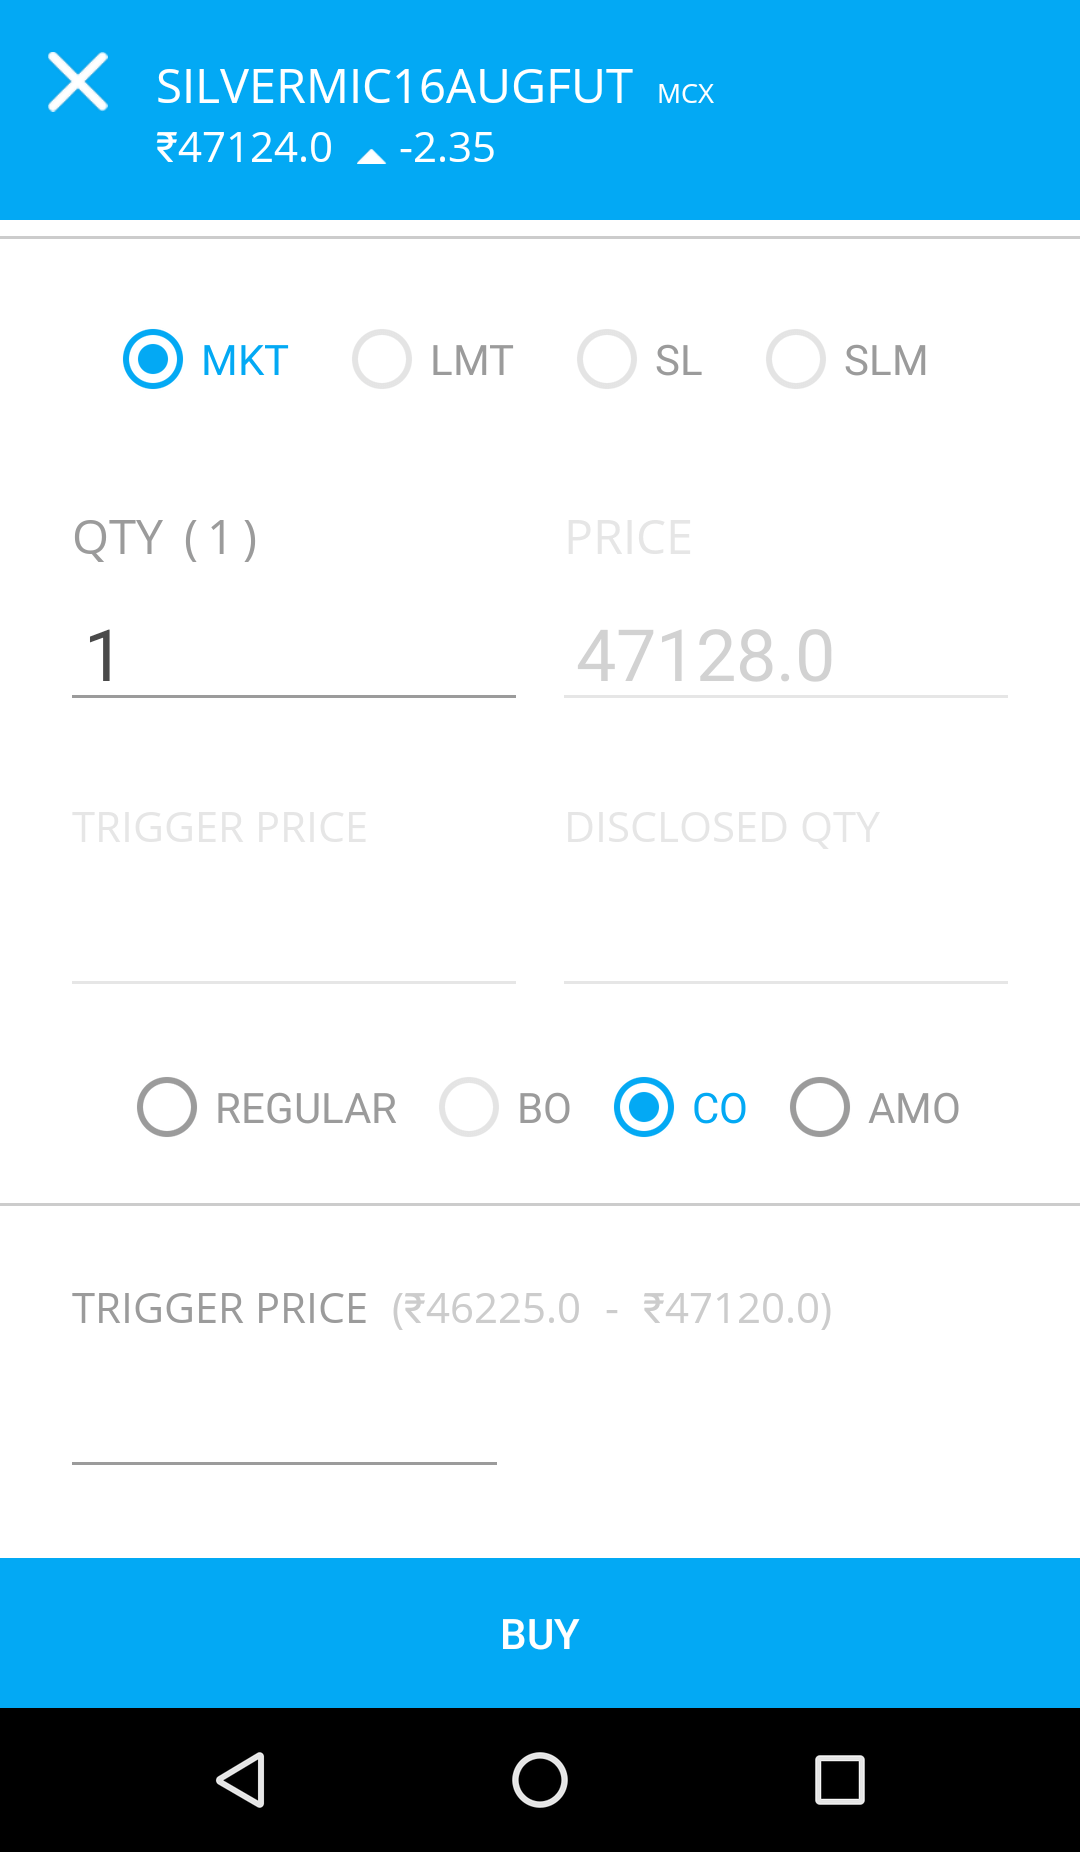
To know more on these order types, click here.
Orderbook

Access the order book from the navigation drawer by clicking on “Orders” or the icon on the top bar. Order book shows pending and executed orders.

Modify or cancel pending orders by tapping on the order in the orderbook.
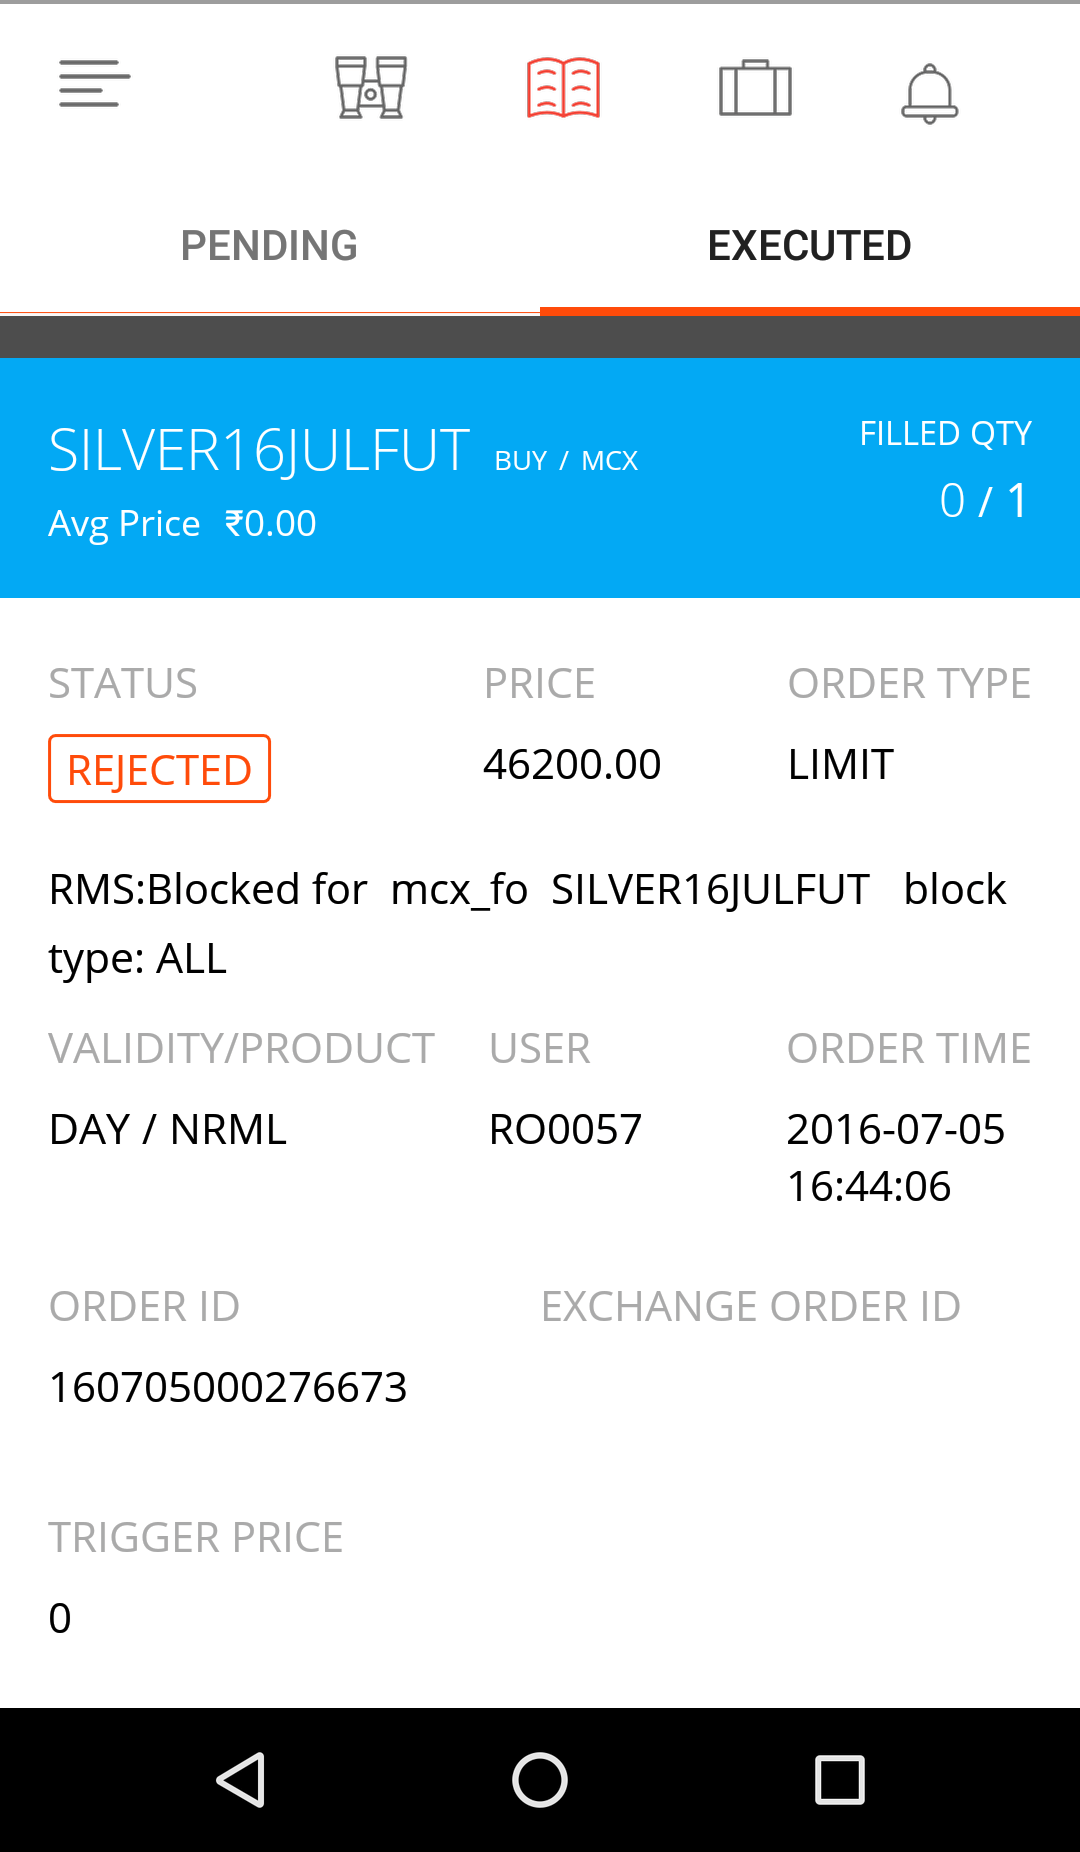
Tap on individual orders to check status, executed price, and any rejection reason.
Portfolio
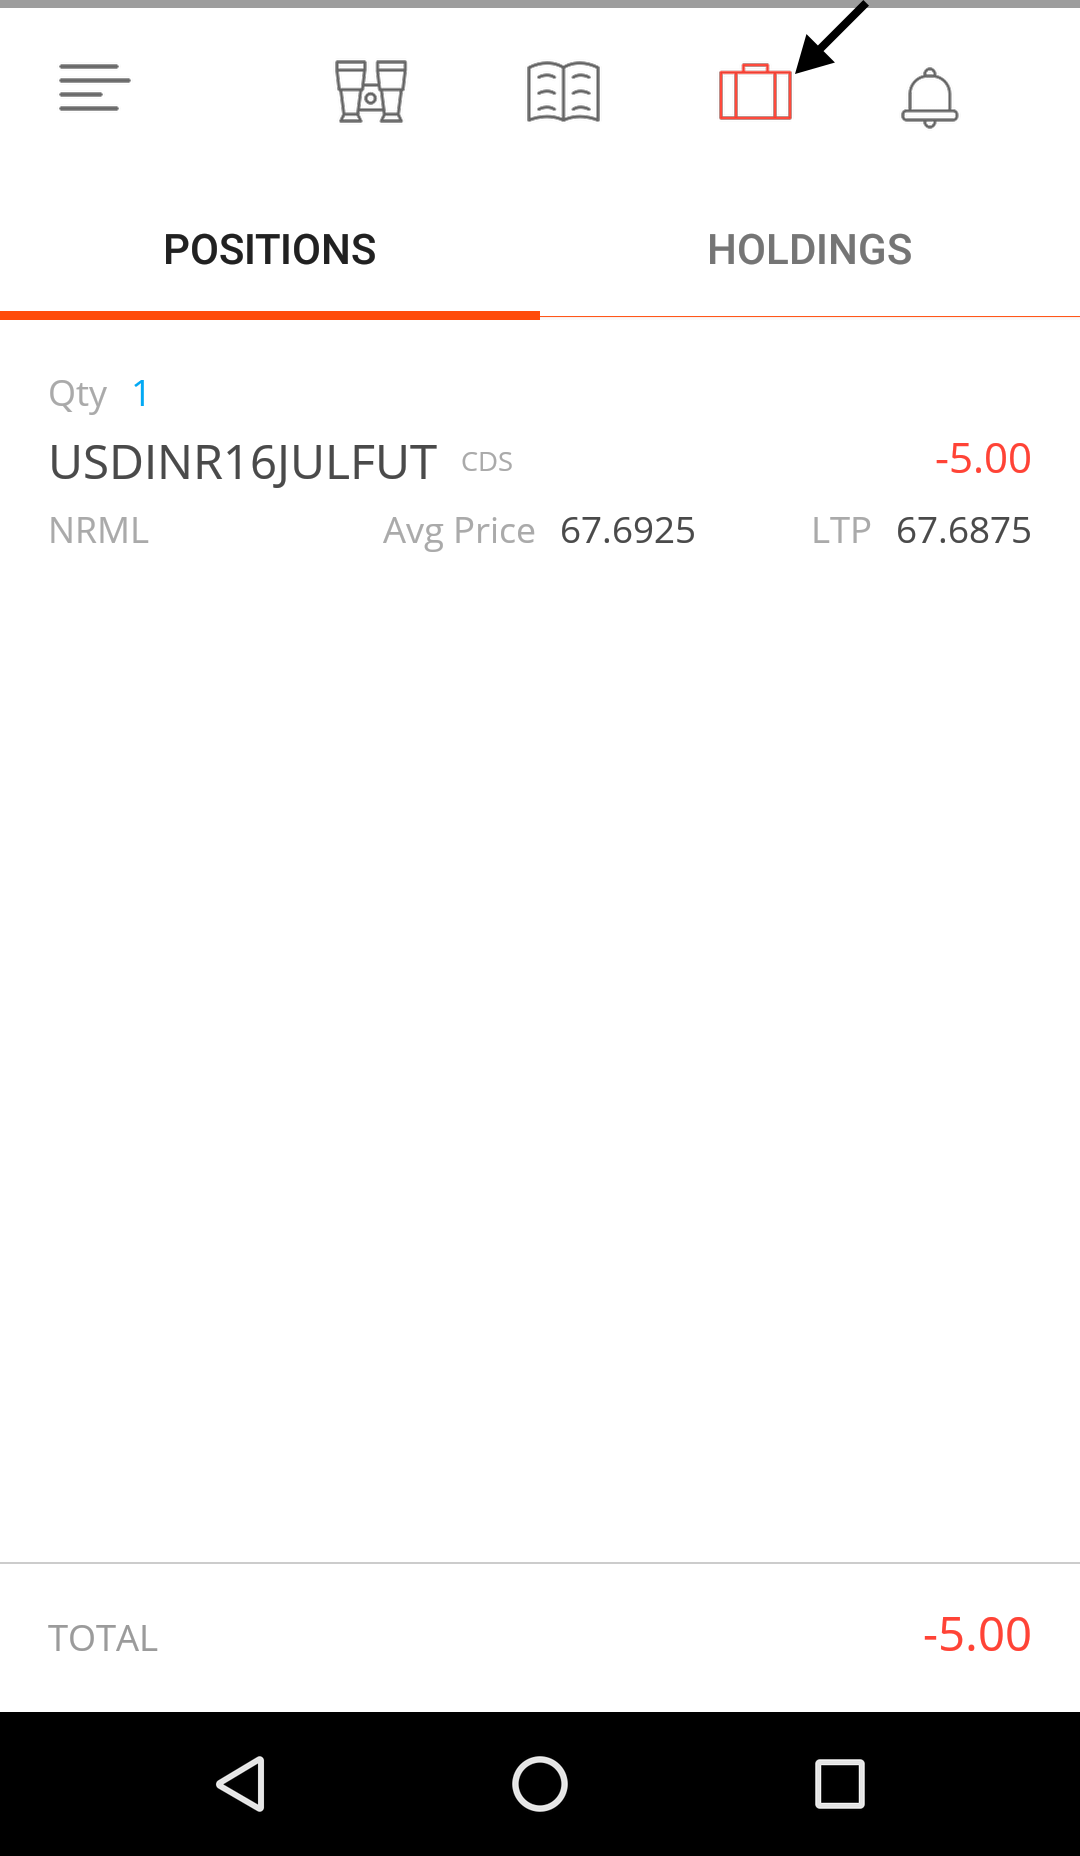
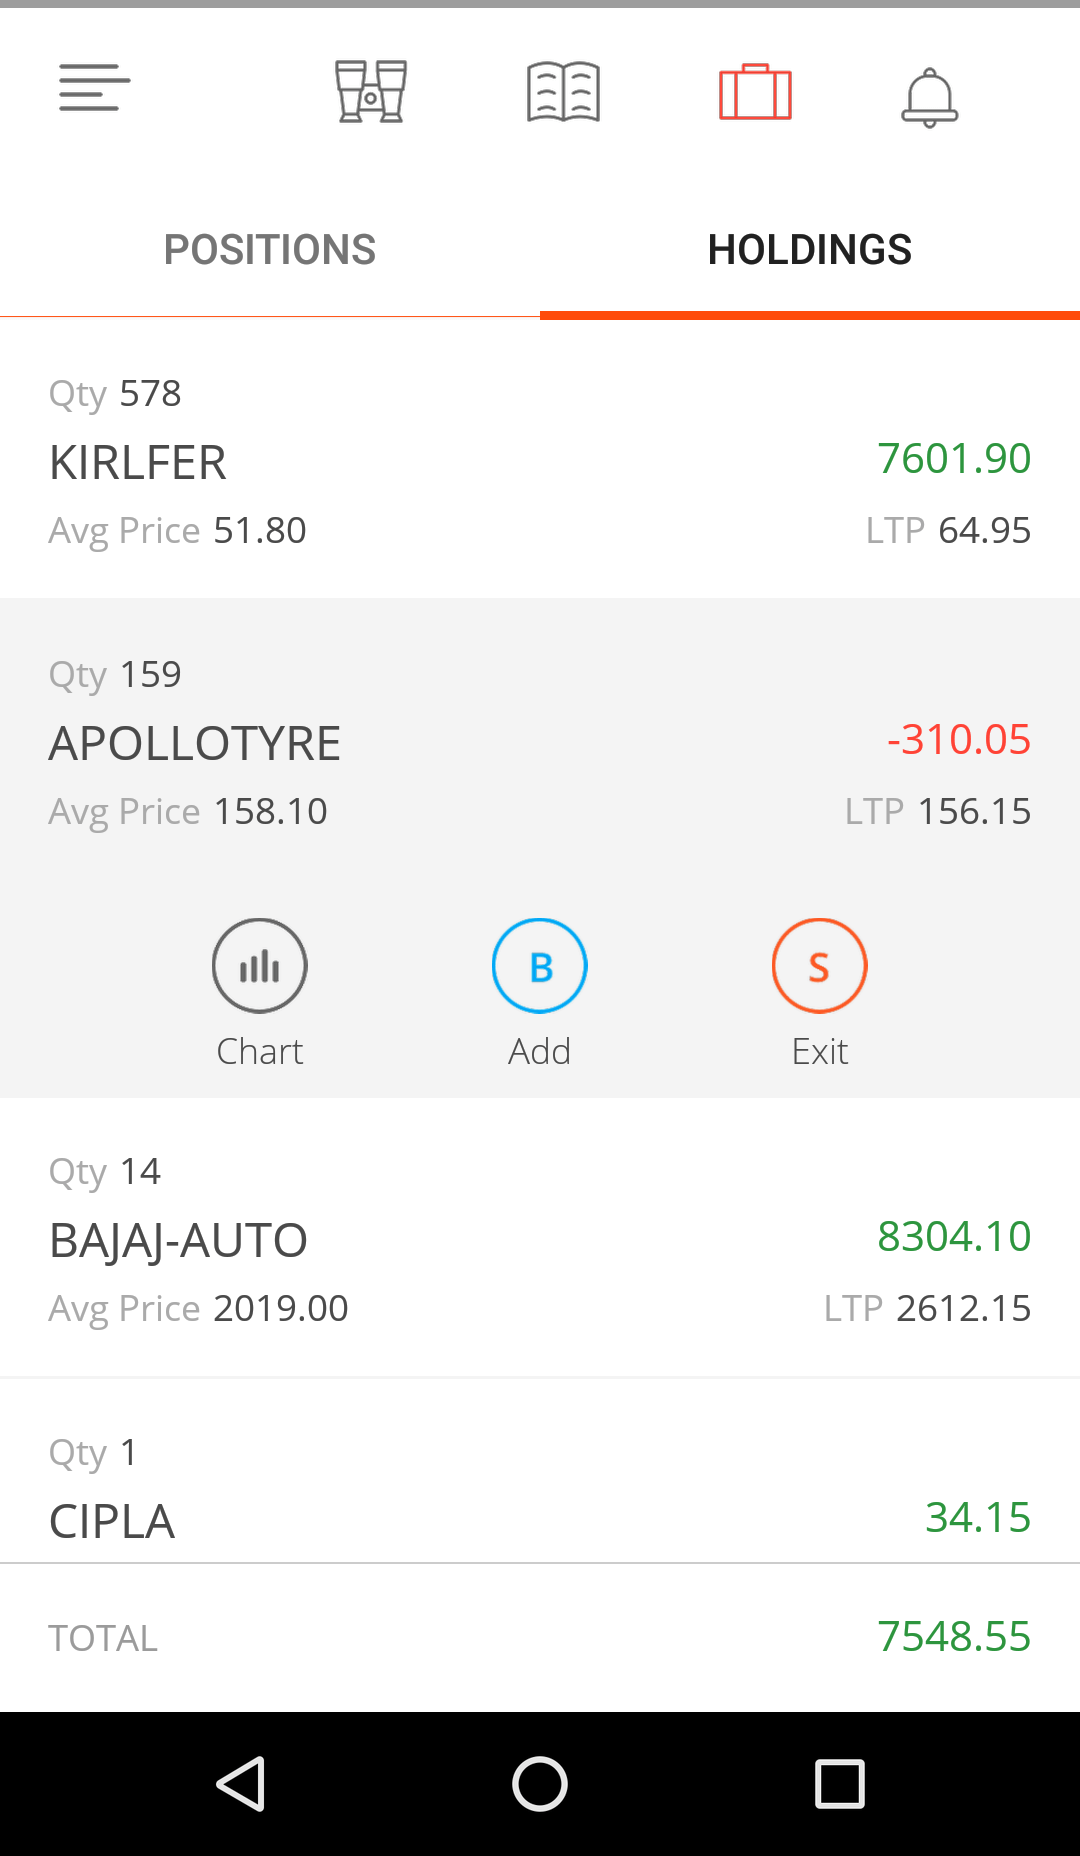
View positions or stocks by clicking on “Portfolio” in the navigation drawer or the icon on the top bar.

Manage positions and holdings from the portfolio screen by tapping on any scrip. View charts, add or exit.
Convert positions

Tapping on open positions allows converting positions from intraday to positional or vice versa.
Charting
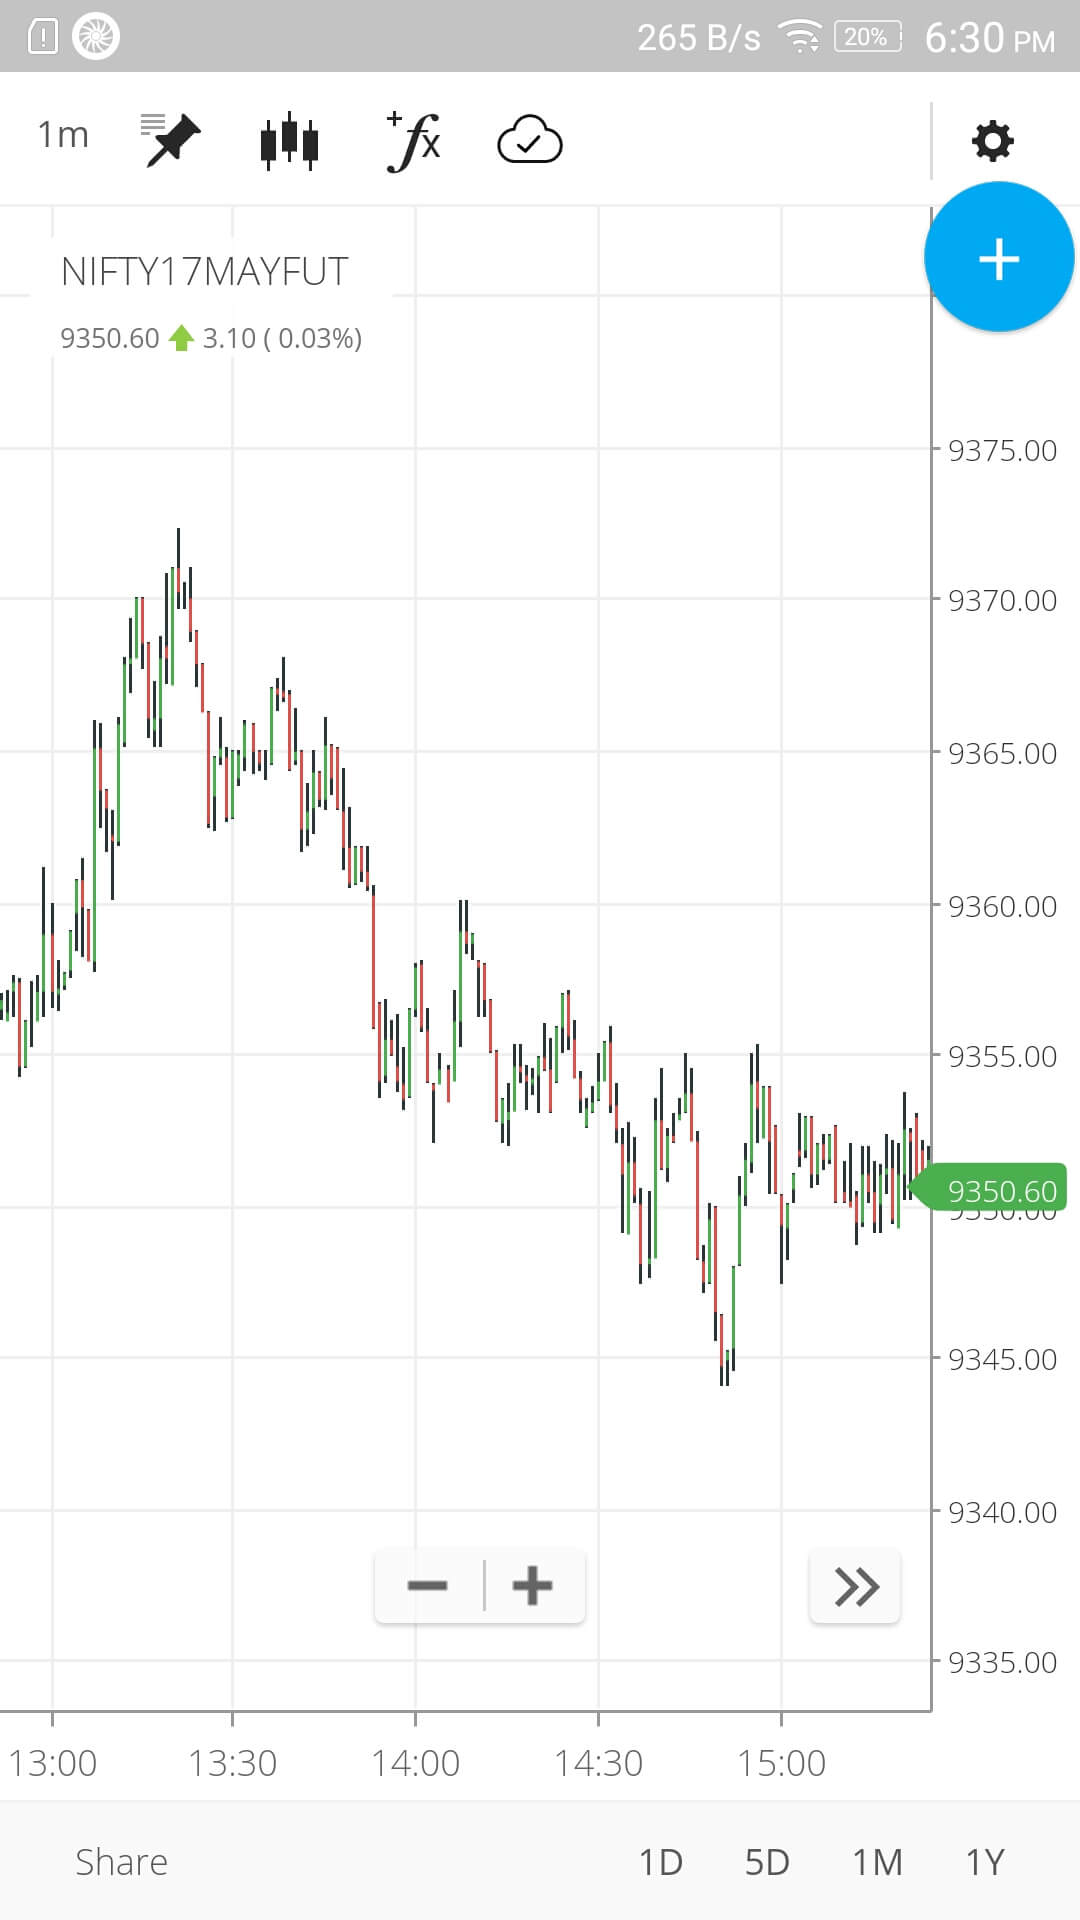
Invoke charts by clicking on the “Chart” button.
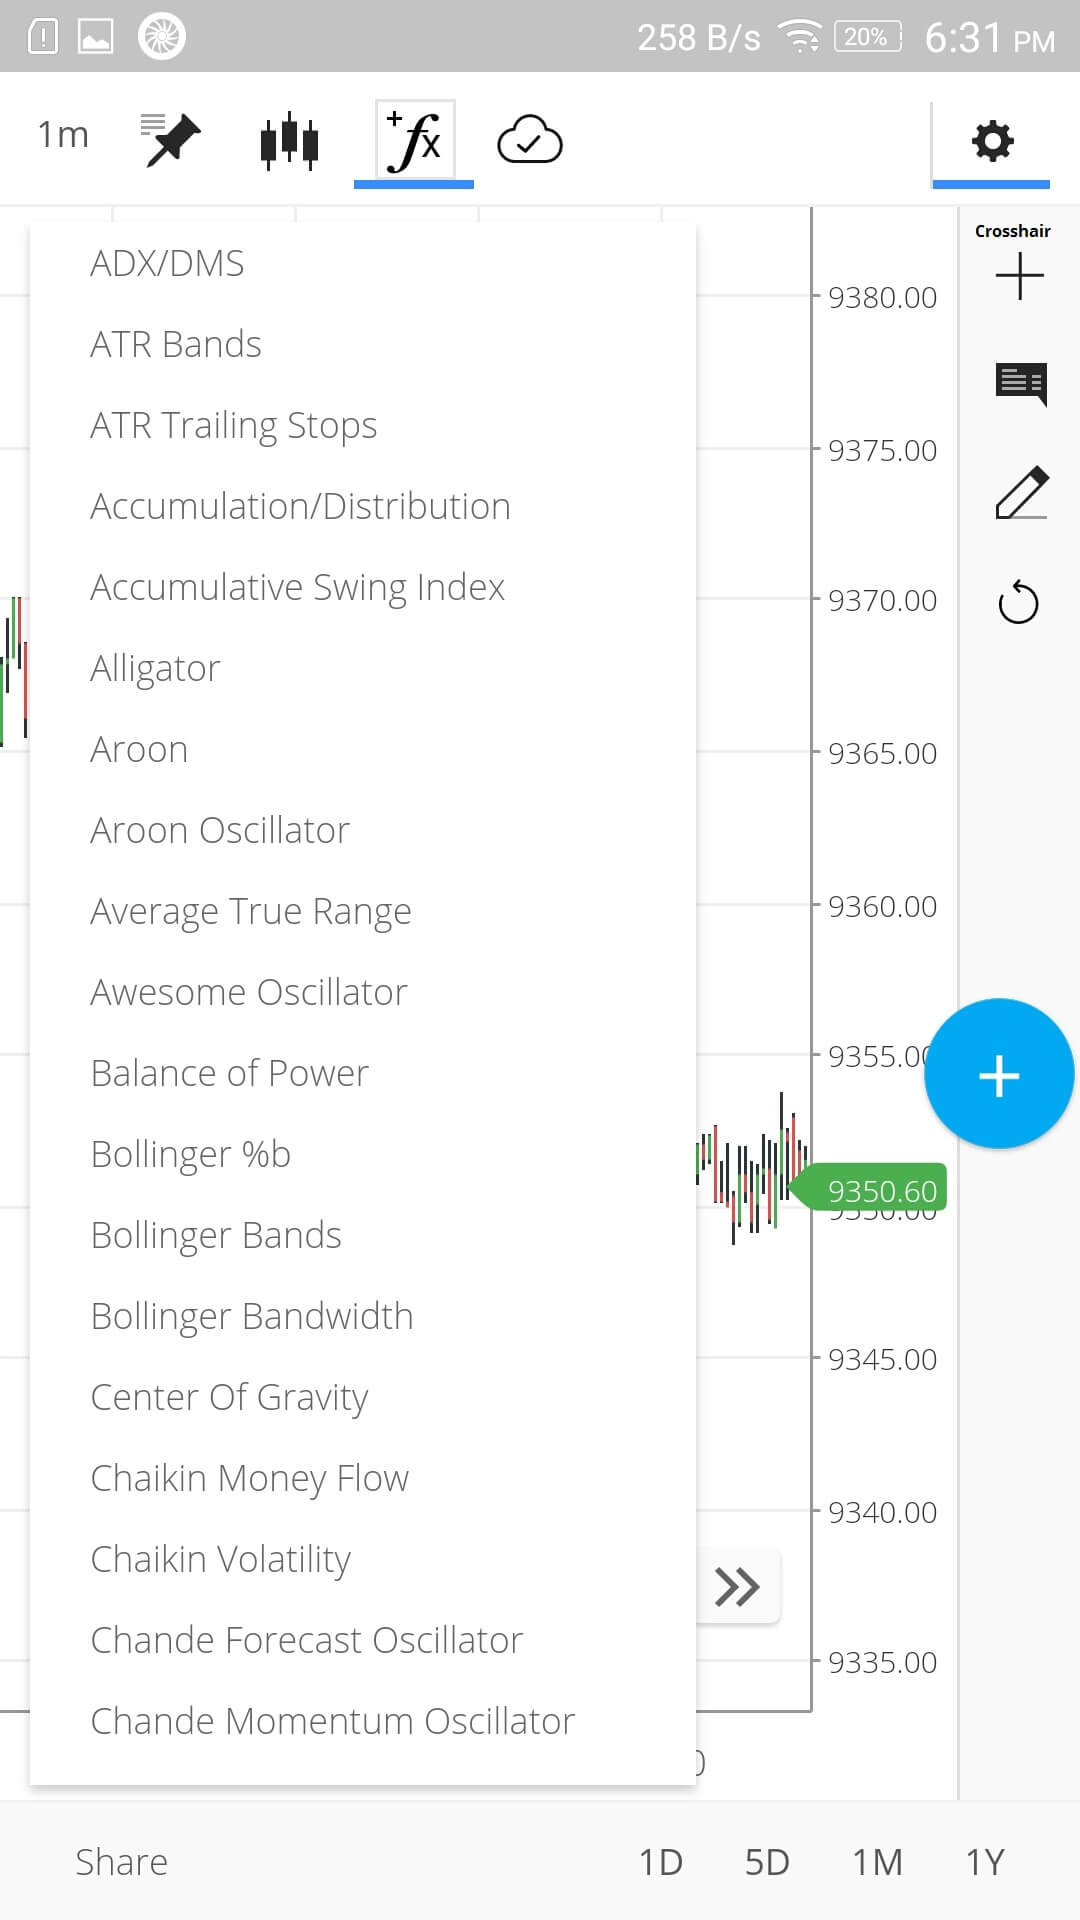
Change timeframes, chart styles, add indicators and drawing as shown below.
Buy or sell from the charts by clicking on the “+” button.
Click here to know more on Kite charting.
Note
Make sure to turn off crosshair or swipe using two fingers horizontally to scroll the charts.
Notifications
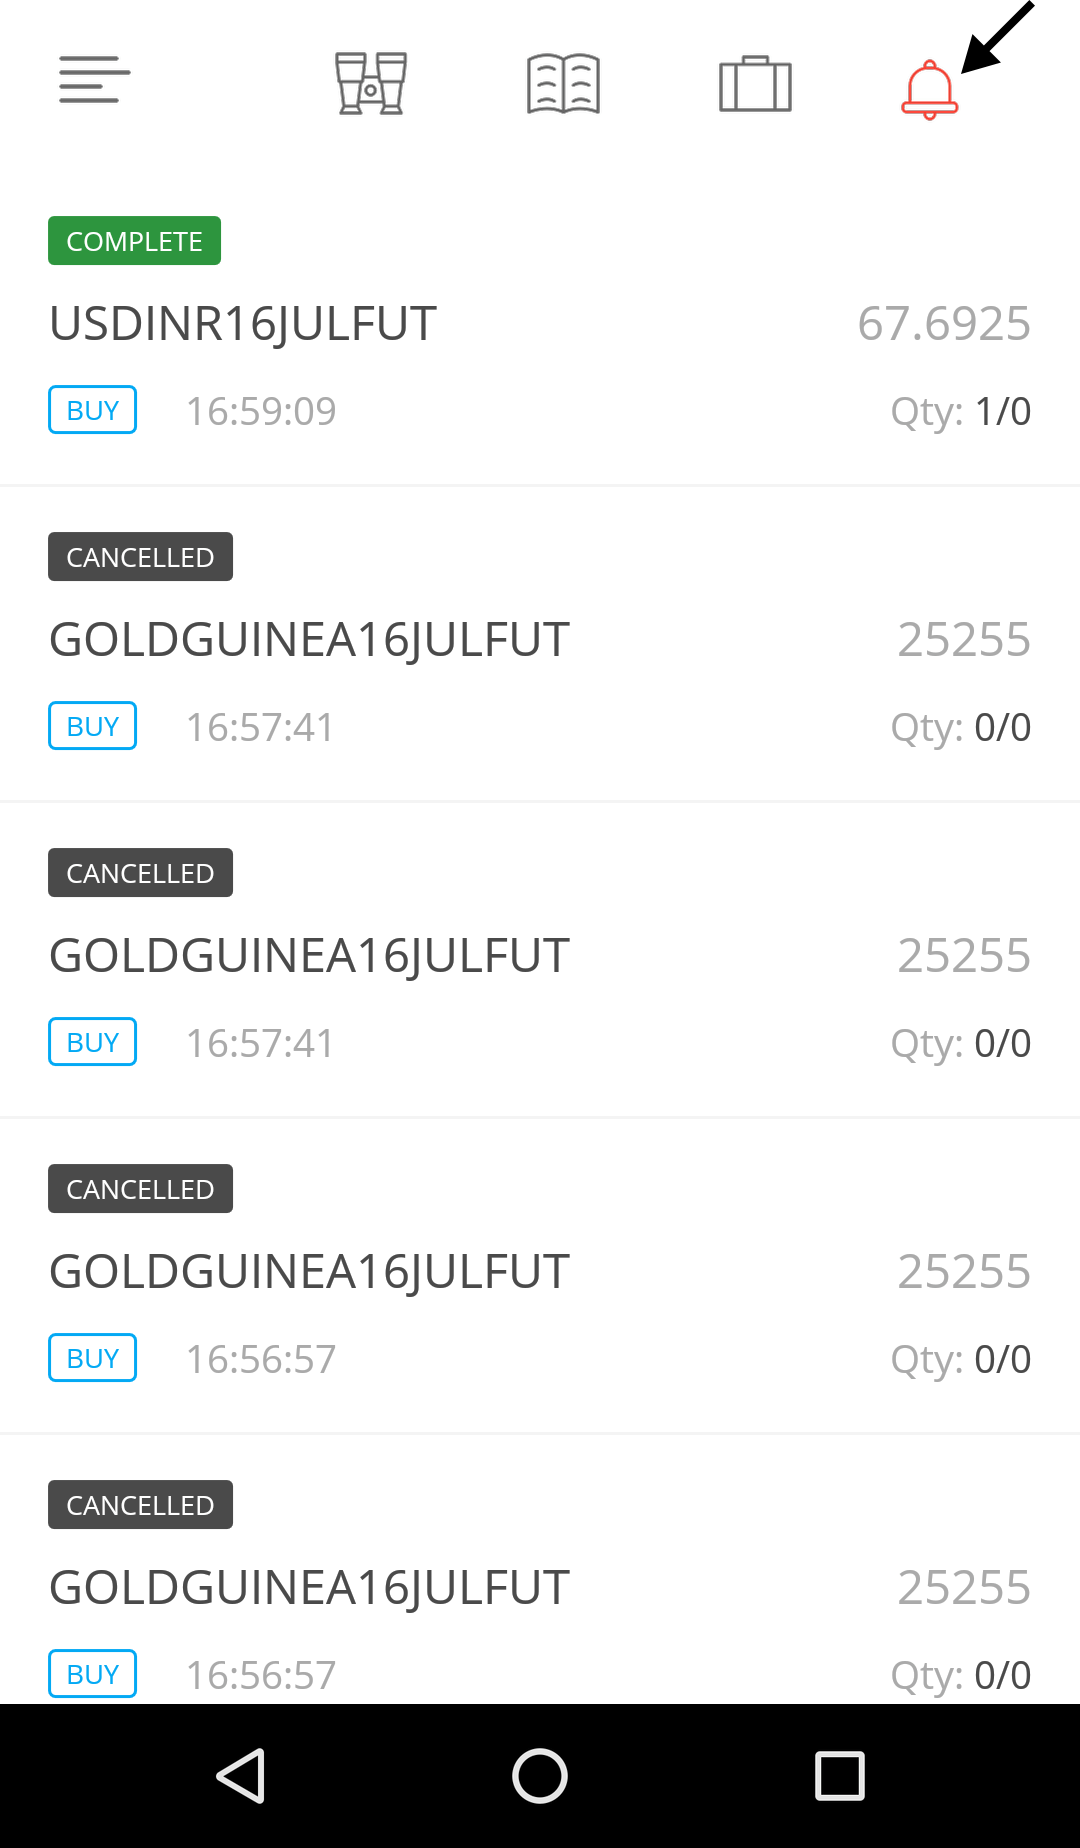
Access the notifications tab from the navigation drawer by clicking on “Notifications” or the icon on the top bar. This tab shows order updates - executed, cancelled or rejected.
Great Post! thanks for sharing useful information with us. If you want to know more about this topic, then click on the below links.
ReplyDeleteThank You!
Currency Trading
Equity Market
I had spent so much time for searching information on this topic. But, a small number of sites I have found. In those, this one helped me a lot. Thanks for sharing wonderful information. If you want to know more about this topic, then click on the below links.
ReplyDeleteThank You!
Trading
Future Market
international trade
US dollar
It is really quality & outstanding post. keep it up!
ReplyDeleteLatest stock market news and updates on the stockinvestor...buy or sell stock ideas by experts for minute to minute updates...
Currency Trading
Stock Trading
Demat Account
Share Trading
I saw your post. it has very good information keep it up. we are also stock market company we provide good stock tips and Stock market Live news...etc
ReplyDeleteForex Trading
ShareTrading
Trading
Stock Trading
Thanks for sharing. It very useful and great blog for eachone.
ReplyDeletePlease click here if you wish to receive further offers from us:
Forex Market
Financial Market
Currency Pairs
Currency Trading
nice information thanks for sharing valuable content with us we also provide great information related to your blog feel free to visit our Forex trading strategies
ReplyDeletenice information thanks for sharing valuable content with us we also provide great information related to your blog feel free to visit our Yes Bank.
ReplyDeleteNice informatiom. Thanks for sharing. You may also check latest updates on Stocks like
ReplyDeleteNirmala Sitharaman about Financial Package
52-week low on NSE
ABB India Q1 results
Bharti Infratel
nice information thanks for sharing valuable content with us we also provide great information related to your blog feel free to visit our
ReplyDeleteSensex.
Nice article thanks for sharing such a valuable information with us.you may also check our blog for more information
ReplyDeleteMRF Limited
S&P BSE Midcap
Hey...Great information thanks for sharing such a valuable information
ReplyDeleteICICI Prudential equity funds
ICICI Prudential Mutual Fund
financial
Really it’s a wonderful guide with good resources. We also offer some beginners guides in stock market section. Checkout our Stock Investor website for more latest stock market update.
ReplyDeleteBharat Gears stock price
Bharat Heavy Electricals Stock Price
Bharat Petroleum Corp Stock Price
BIBCL Share Price
Good information !Thanks for sharing
ReplyDeleteCaptain Technocast Ltd
Nice article. stockinvestor.in shares information related to stock market like stock market analysis, advices the tips to invest in stock market and also provides stock market recommendations.
ReplyDeletecompanies
shares
Equity shares
nice article, wish to learn more about stock market and stock/share market Live Updates from this site HDFC bank share price
ReplyDelete