
12.1 – Overview
For a market participant transacting just based on company specific information may not be sufficient. It is also important to understand the events that influence the markets. Various outside factors, economic and/or non-economic events have a key impact on the performance of stocks and markets in general.
In this chapter we will try to understand some of these events, and also how the stock market reacts to them.
12.2 – Monetary Policy
The monetary policy is a tool with which the Reserve Bank of India (RBI) controls the money supply by controlling the interest rates. They do this by tweaking the interest rates. RBI is India’s central bank. World over every country’s central bank is responsible for setting the interest rates.
While setting the interest rates the RBI has to strike a balance between growth and inflation. In a nutshell – if the interest rates are high that means the borrowing rates are high (particularly for corporations). If corporate can’t borrow easily they cannot grow. If corporations don’t grow, the economy slows down.
On the other hand when the interest rates are low, borrowing becomes easier. This translates to more money in the hands of the corporations and consumers. With more money there is increased spending which means the sellers tend to increase prices leading to inflation.
In order to strike a balance, the RBI has to consider all the factors and should carefully set a few key rates. Any imbalance in these rates can lead to an economic chaos. The key RBI rates that you need to track are as follows:
Repo Rate – Whenever banks want to borrow money they can borrow from the RBI. The rate at which RBI lends money to other banks is called the repo rate. If repo rate is high that means the cost of borrowing is high, leading to a slow growth in the economy. Currently, the repo rate in India is 8%. Markets don’t like the RBI increasing the repo rates.
Reverse repo rate – Reverse Repo rate is the rate at which RBI borrows money from banks. When banks lend money to RBI they are certain that RBI will not default, and hence they are happier to lend their money to RBI as opposed to a corporate. However when banks choose to lend money to the RBI instead of the corporate entity, the supply of money in the banking system reduces. An increase in reverse repo rate is not great for the economy as it tightens the supply of money. The reverse repo rate is currently at 7%.
Cash reserve ratio (CRR) – Every bank is mandatorily required to maintain funds with RBI. The amount that they maintain is dependent on the CRR. If CRR increases then more money is removed from the system, which is again not good for the economy.
The RBI meets every two months to review the rates. This is a key event that the market watches out for. The first to react to rate decisions would be interest rate sensitive stocks across various sectors such as – banks, automobile, housing finance, real estate, metals etc.
12.3 – Inflation
Inflation is a sustained increase in the general prices of goods and services. Increasing inflation erodes the purchasing power of money. All things being equal, if the cost of 1 KG of onion has increased from Rs.15 to Rs.20 then this price increase is attributed to inflation. Inflation is inevitable but a high inflation rate is not desirable as it could lead to economic uneasiness. A high level of inflation tends to send a bad signal to markets. Governments work towards cutting down the inflation to a manageable level. Inflation is generally measured using an index. If the index is going up by certain percentage points then it indicates rising inflation, likewise index falling indicates inflation cooling off.
There are two types of inflation indices – Wholesale Price Index (WPI) and Consumer Price Index (CPI).
Wholesale Price Index (WPI) – The WPI indicates the movement in prices at the wholesale level. It captures the price increase or decrease when they are sold between organizations as opposed to actual consumers. WPI is an easy and convenient method to calculate inflation. However the inflation measured here is at an institutional level and does not necessarily capture the inflation experienced by the consumer.
As I write this, the WPI inflation for the month of May 2014 stands at 6.01%.
Consumer Price Index (CPI)– The CPI on the other hand captures the effect of the change in prices at a retail level. As a consumer, CPI inflation is what really matters. The calculation of CPI is quite detailed as it involves classifying consumption into various categories and sub categories across urban and rural regions. Each of these categories is made into an index. This means the final CPI index is a composition of several internal indices.
The computation of CPI is quite rigorous and detailed. It is one of the most critical metrics for studying the economy. A national statistical agency called the Ministry of Statistics and Programme implementation (MOSPI) publishes the CPI numbers around the 2nd week of every month.
The CPI stands at 8.28% for the month of May 2014. Here is a chart for the inflation for the last one year in India.
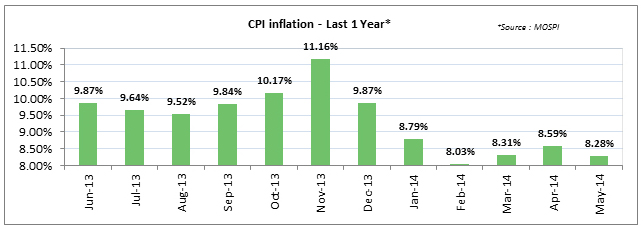
As you can notice, the CPI inflation has kind of cooled off from the peak of 11.16% in November 2013. The RBI’s challenge is to strike a balance between inflation and interest rates. Usually a low interest rate tends to increase the inflation and a high interest rate tends to arrest the inflation.
12.4 – Index of Industrial Production (IIP)
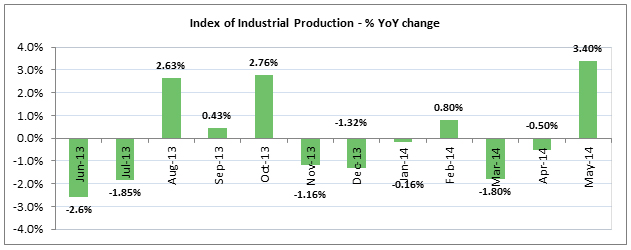
The Index of Industrial Production (IIP) is a short term indicator of how the industrial sector in the country is progressing. The data is released every month (along with inflation data) by Ministry of Statistics and Programme implementation (MOSPI). As the name suggests, the IIP measures the production in the Indian industrial sectors keeping a fixed reference point. As of today, India uses the reference point of 2004-05. The reference point is also called the base year.
Roughly about 15 different industries submit their production data to the ministry, which collates the data and releases it as an index number. If the IIP is increasing it indicates a vibrant industrial environment (as the production is going up) and hence a positive sign for the economy and markets. A decreasing IIP indicates a sluggish production environment, hence a negative sign for the economy and markets.
To sum up, an upswing in the industrial production is good for the economy and a downswing rings an alarm. As India is getting more industrialized, the relative importance of the Index of Industrial Production is increasing.
A lower IIP number puts pressure on the RBI to lower the interest rates. The following graph shows the change in IIP in percentage terms for the last 1 year.
12.5 – Purchasing Managers Index (PMI)
The Purchasing managers index (PMI) is an economic indicator which tries to capture the business activity across the manufacturing and service sectors in the country. This is a survey based indicator where the respondents – usually the purchasing managers indicate their change in business perception with respect to the previous month. A separate survey is conducted for the service and the manufacturing sectors. The data from the survey is consolidated on to a single index. Typical areas covered in the survey include factors such as new orders, output, business expectations and employment amongst others.
The PMI number usually oscillates around 50. A reading above 50 indicates expansion and below 50 indicates a contraction in the economy. And a reading at 50 indicates no change in the economy.
12.6 – Budget
The Budget is an event during which the Ministry of Finance discusses the country’s finance in detail. The Finance Minister on behalf of the ministry makes a budget presentation to the entire country. During the budget, major policy announcements and economic reforms are announced which has an impact on various industries across the markets. Therefore the budget plays a very important role in the economy
To illustrate this further, one of the expectations for the budget (July 2014) was to increase the duties on cigarette. As expected, during the budget, the Finance Minister raised the duties on cigarette, and hence the prices of cigarettes were also increased. An increased cigarette price has a few implications:
- Increased cigarette prices discourage smokers from buying cigarettes (needless to say this is a debatable) and hence the profitability of the cigarette manufacturing companies such as ITC decreases. If the profitability decreases then investors may want to sell shares of ITC.
- If market participants start selling ITC, then the markets will come down because ITC is an index heavy weight.
In fact as a reaction to the budget announcement ITC traded 3.5% lower for this precise reason.
Budget is an annual event and it is announced during the last week of February. However under certain special circumstances such as a new government formation the budget announcement could be delayed.
12.7 – Corporate Earnings Announcement
This is perhaps one of the important events to which the stocks react. The listed companies (trading on stock exchange) are required to declare their earning numbers once in every quarter, also called the quarterly earning numbers. During an earnings announcement the corporate gives out details on various operational activities including..
- How much revenue the company has generated?
- How has the company managed its expense?
- How much money the company paid in terms of taxes and interest charges?
- What is the profitability during the quarter?
Besides some companies give an overview of what they expect from the upcoming quarters. This forecast is called the ‘corporate guidance’.
Invariably every quarter the first blue chip company to make the quarterly announcement is Infosys Limited. They also give out guidance regularly. Market participants keenly follow what Infosys has to say in terms of guidance as it has an overall impact on the markets.
The table below gives you an overview of the earning season in India:
| Sl No | Months | Quarter | Result Announcement |
|---|---|---|---|
| 01 | April to June | Quarter 1 (Q1) | 1st week of July |
| 02 | July to September | Quarter 2 (Q2) | 1st week of Oct |
| 03 | October to December | Quarter 3 (Q3) | 1st Week of Jan |
| 04 | January to March | Quarter 4 (Q4) | 1st Week of April |
Every quarter when the company declares their earnings, the market participants match the earnings with their own expectation of how much the company should have earned. The market participant’s expectation is called the ‘street expectation’.
The stock price will react positively if the company’s earnings are better than the street expectation. On a similar logic, the stock price will react negatively if the actual numbers are below the street expectation.
If the street expectation and actual numbers match, more often than not the stock price tends to trade flat with a negative bias. This is mainly owing to fact that the company could not give any positive surprises.
Key takeaways from this chapter
- Markets and individual stocks react to events. Market participants should equip themselves to understand and decipher these events
- Monetary policy is one of the most important economic event. During the monetary policy, review actions on repo, reverse repo, CRR etc are initiated
- Interest rates and inflation are related. Increasing interest rates curbs inflation and vice versa
- Inflation data is released every month by MOSPI. As a consumer, CPI inflation data is what you need to track
- IIP measures the industrial production activity. Increase in IIP cheers the markets and lower IIP disappoints the market
- PMI is a survey based business sentiment indicator. The PMI number oscillates around the 50 mark. Above 50 is good news to markets and PMI below 50 is not.
- The Budget is an important market event where policy announcements and reform initiatives are taken. Markets and stocks react strongly to budget announcements
- Corporate earnings are reported every quarter. Stocks react mainly due to the variance in actual number versus the street’s expectation.
Comments
Post a Comment