
9.1 – Overview
When a market participant wants to transact in the market, he can do so by opting one of the options:
- Call the stockbroker, and trade usually called “Call & Trade”
- Use a web application like Zerodha Kite on a computer browser to access the markets
- Use the trading software like Pi
Each of the above methods is a gateway to the exchanges. The gateway allows you to do multiple things such as transacting in shares, tracking your Profit & Loss, tracking market movements, following news, managing your funds, viewing stock charts, accessing trading tools etc. The purpose of this chapter is to familiarize you with the Kite(or a similar web platform), and its interface.
You can access the trading terminal(TT) by simply entering the URL on your browser. For Zerodha Kite, it is kite.zerodha.com. It is quite a user-friendly interface, as most of its functionalities are menu driven. To access the trading terminal, you need to have a trading account with your broker.
A good trading terminal offers you numerous useful features. We will start by understanding a few basic features. To keep this chapter as practical as possible let us set two basic tasks to using the trading terminal.
- Buy 1 share of ITC, and
- Track the price of Infosys
While we achieve the above two tasks, we will also learn about all the relevant concepts. For the purpose of this chapter, we will be using Zerodha’s web platform ‘Kite’
9.2 – The login process
The trading terminal is quite sensitive as it contains all your trading account information. In order to ensure adequate security, brokers usually follow a stringent login process. The process involves entering your password and answering two secret questions, the answers to which only you know. The snapshot below shows this process.

9.3 – The Market watch
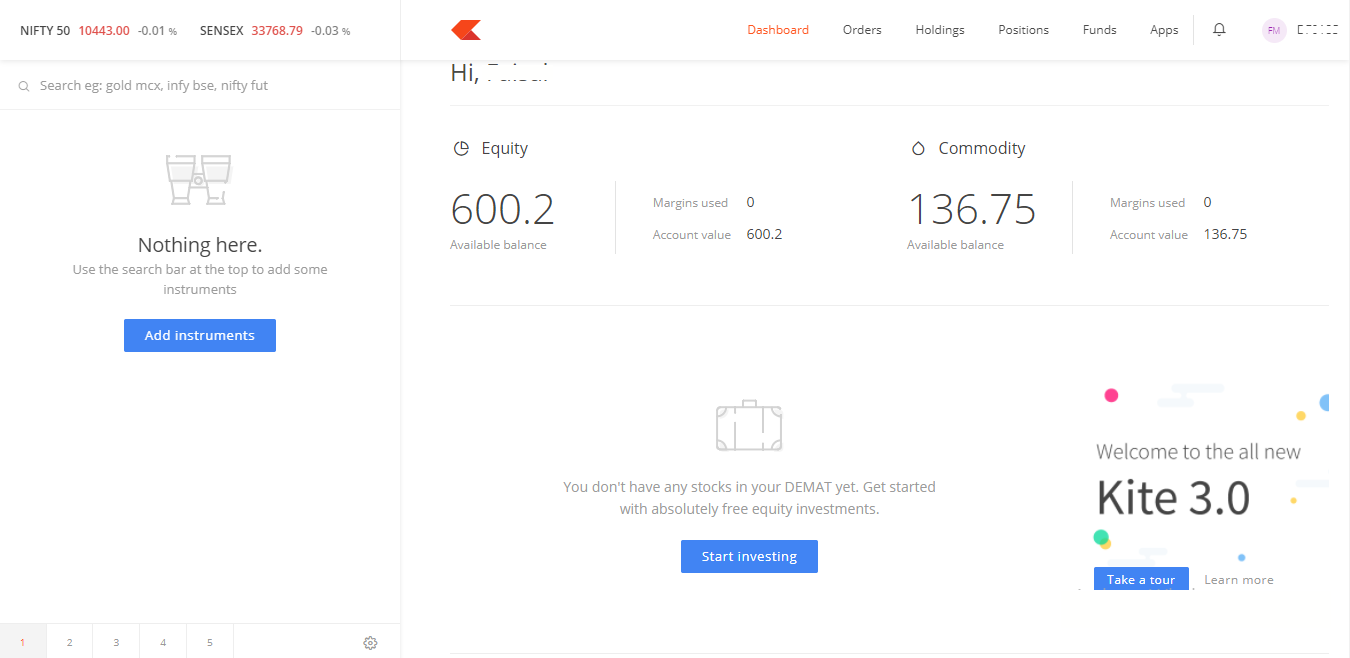
Once your login to the platform you will have to populate the ‘market watch’ with the stocks you are interested. Think about the market watch as a blank slate. Once the stock is loaded on the market watch you can easily transact and query information about it. A blank market watch looks like this (this is also the screen that you see once you log in)
Keeping the first task in mind we will load ITC Ltd onto the market watch. To do this we simply have to type in the stock symbol ITC in the search bar and the drop down will show the stock in different exchanges(NSE/BSE)
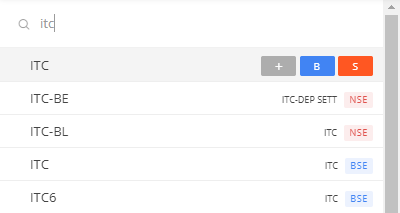
Click on the Add symbol to add the stock to the marketwatch
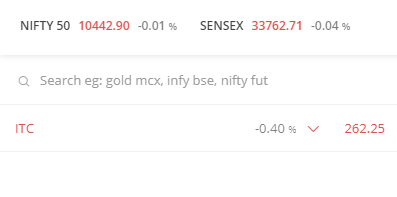
The marketwatch will display last traded price, percentage change of the stock
- The last traded price of the stock (LTP) – This gives us a sense of how much the stock is trading at the very moment
- Percentage change – This indicates the percentage points the LTP is varying with respect to the previous day close
Some basic information that will be needed at this point would be:
- Previous day close – At what price did the stock close the previous day
- OHLC – Open, High, Low and Close gives us a sense of the range within which the stock is trading during the day
- Volumes – Gives a sense on how many shares are being traded at a particular point of time
You can find this information under Market Depth. If you hover over the stock name, you will find Buy, Sell, Market Depth and Stock Information. If you click on Marketdepth, you will find the above information along with the best bid and ask price ladder. We will be covering Bid and Ask price in the later part of the Chapter.

As you can see, the last traded price of ITC is Rs.262.25, it is trading -0.40% lower than the previous day close which is Rs.263.30. The open for the day was at Rs.265.90, the highest price and the lowest price at which the stock traded for the day was Rs.265.90 and Rs.262.15 respectively. The volume for the day is close to 27 lakh shares.
9.4 – Buying a stock through the trading terminal
Our goal is to buy 1 share of ITC. We now have ITC in our trading terminal, and we are convinced that buying ITC at Rs.261, which is roughly Rs.1.25 lesser than the last traded price is a great idea.
The first step for this process would be to invoke what is called a buy order form.
- Hover over the stock you want to Buy and click on the Buy Icon(B)
- This will invoke the Buy. When the buy order form is invoked, the following order form will appear on your screen.
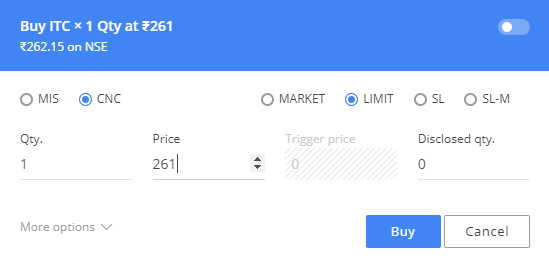
The order form is pre populated with some information like the price and quantity. We need to modify this as per our requirement. Let us begin by the first drop down option on the top. By default, the exchange specified would be NSE.
The next entry is the ‘order type’. By clicking on the drop down menu you will see the following four options:
- Limit
- Market
- SL
- SL-Market
Let us understand what these options actually mean.
You can opt for a ‘Limit’ order when you are very particular about the price you want pay for a stock. In our case, the last traded price of ITC is Rs.262.25 but say we want to limit our buy price to Rs.261. In such a situation where we are particular about the price we want to transact in, we can opt for a limit order price. If the price does not fall to Rs.261, then you will not get the shares. This is one of the drawbacks of a limit order.
You can also opt for a market order when you intend to buy at market available prices instead of a very specific price that you have in mind. So if you were to place a market order, as long as there are sellers available, your order will go through and ITC will be bought in the vicinity of Rs.262.25. Suppose the price goes up to Rs.265 coinciding with your market order placement, then you will get ITC at Rs.265. This means when you place a market order, you will never be sure of the price at which you would transact, and this could be quite a dangerous situation if you are an active trader.
A stop loss order protects you from an adverse movement in the market after initiating a position. Suppose you buy ITC at Rs.262.25 with an expectation that ITC will hit Rs.275 in the near future. But instead, what if the price of ITC starts going down? We can protect ourselves firstly by defining what would be the worst possible loss you are willing to take. For instance, in the example let us assume you don’t want to take a loss beyond Rs.255
This means you have gone long on ITC at Rs.262.25 and the maximum loss you are willing to take on this trade is Rs.6 (255). If the stock price drops down to Rs.255, the stop loss order gets active and hits the exchange and you will be out of the loss making position. As long as the price is above 255 the stop loss order will be dormant.
A stop loss order is a passive order. In order to activate it, we need to enter a trigger price. A trigger price, usually above the stop loss price acts as a price threshold and only after crossing this price the stop loss order transitions from a passive order to an active order.
Going with the above example:
We are long at Rs.261. In case the trade goes bad we would want to get rid of the position at Rs.255, therefore 255 is the stop loss price. The trigger price is specified so that the stoploss order would transition from passive to active order. The trigger price has to be higher/equal than the stop loss price. We can set this to Rs.255 or higher. If the price drops below 255 the stop loss order gets active.
Going back to the main buy order entry form, once the order type is selected we now move directly to the quantity. Remember the task is to buy 1 share of ITC; hence we enter 1 in the quantity box. We ignore the trigger price and disclosed quantity for now. The next thing to select would be the product type.
Select CNC for delivery trades. Meaning if your intention is to buy and hold the shares for multiple days/months/years then you need to ensure the shares reside in your demat account. Selecting CNC is your way of communicating this to your broker.
Select NRML or MIS if you want to trade intraday. MIS is a margin product; we will understand more on this when we take up the module on derivatives.
Once these details are filled in your order form, the order is good to hit the markets. The order gets transmitted to the exchange as soon as you press the submit button on the order form. A unique order ticket number is generated against your order.
Once the order is sent to the exchange it will not get executed unless the price hits Rs.261. As soon as the price drops to Rs.261 (and assuming there are sellers willing to sell 1 shares) you order gets through, and is eventually executed. As soon as your order is executed, you will own 1 shares of ITC.
9.5 – The order book and Trade book
The order book and trade book are two online registers within trading terminal. The order book keeps track of all the orders that you have sent to the exchange and the trade book tracks all the trades that you have transacted during the day.
The order book has all the details regarding your order. You can navigate to the orderbook by clicking the Orders tab
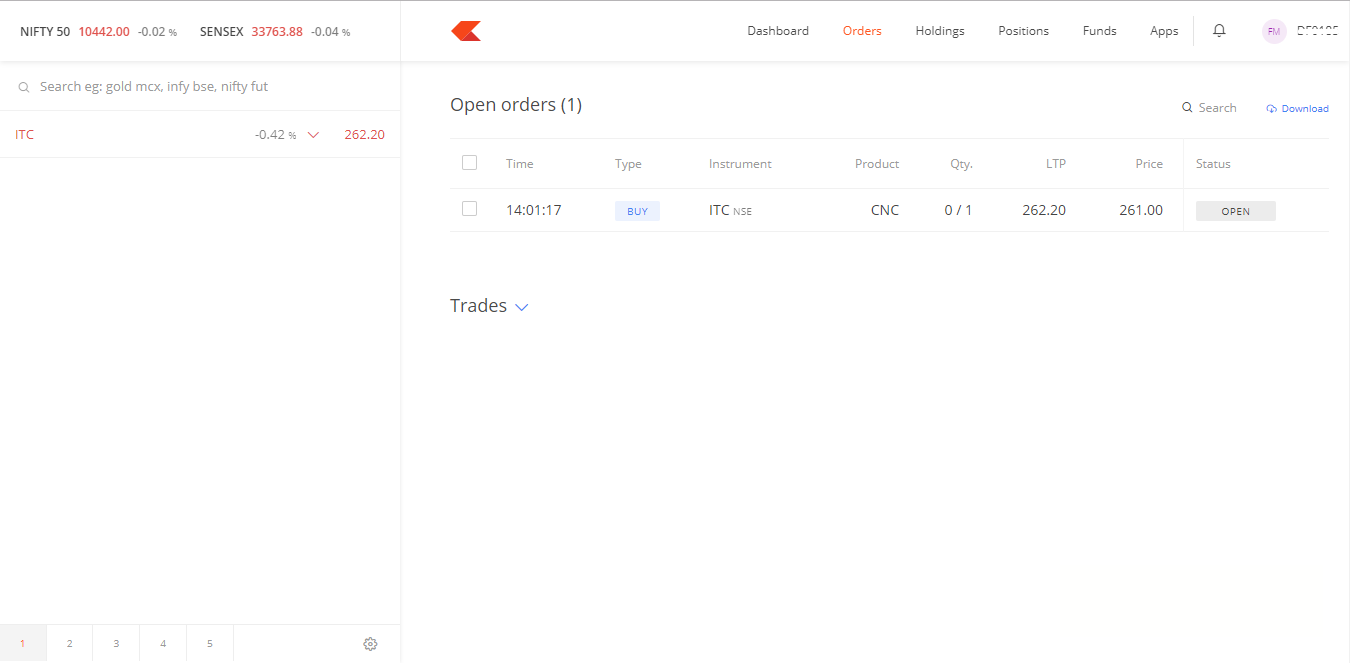
The order book provides the details of the orders you have placed. You should access the order book to:
- Double check the order details – quantity, price, order type, product type
- Modify the orders – For example if you want to modify the buy order from 332 to 333 you can do so from the order book
- Check Status – After you have placed the order you can check the status of the same. The status would state open if the order is completed partially, it would state completed if the order has been completed, and it would state rejected if your order has been rejected. You can also see the details of the rejection in the order book.
If you notice, there is an open order to buy 1 share of ITC at Rs.261.
If you hover over the pending orders, you can find the option to modify or cancel the order
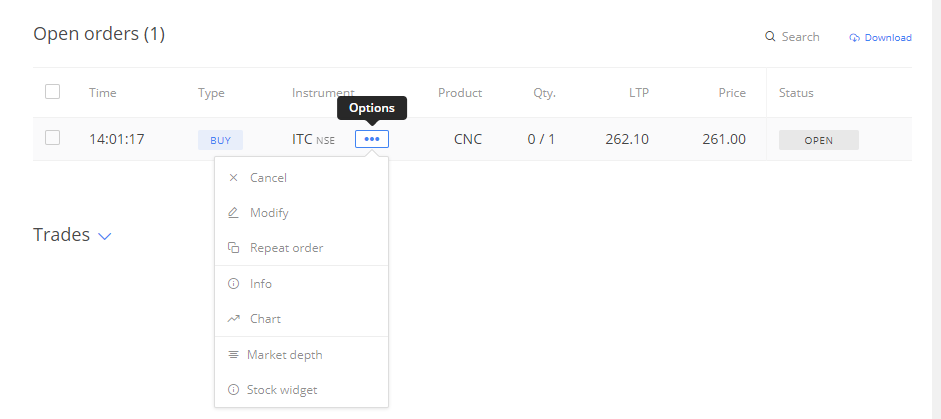
By clicking ‘modify’ the order form will be invoked and you can make the desired changes to the order.
Once the order has been processed and the trade has been executed, the trade details will be available in the trade book. You can find the trade book just below the orderbook
Here is a snapshot of the trade book
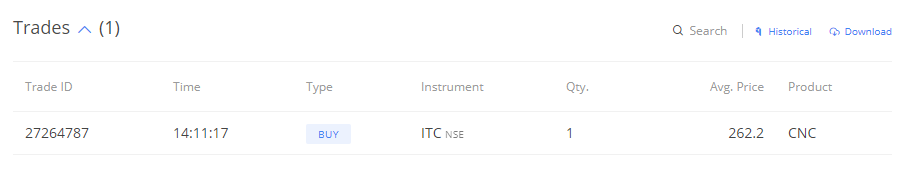
The trade book confirms that the user executed an order to buy 1 share of ITC at Rs 262.2. Also notice a unique exchange order number is generated for the trade.
So with this our first task is complete!
You now officially own 1 share of ITC. This share will reside in our DEMAT account till you decide to sell it.
The next task is to track the price of Infosys. The first step would be to add Infosys to the market watch. We can do this by searching for Infosys in the search box.
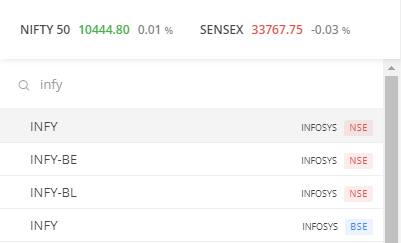
The trading symbol for Infosys is Infy. Once we select Infy, we press Add to add it to the market watch.
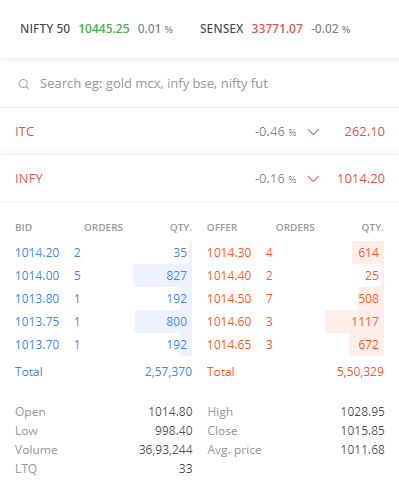
We can now track some live information about Infosys. The last trade price is Rs.1014.75; the stock is down -0.11% from its previous days close of Rs.1015.85. Infosys opened the day at Rs.1014.80 made a low of Rs.998.40 and a high of Rs.1028.95. The volumes were 3.6 million shares.
Please note, while the open price will be fixed at Rs. 1014.80 the high and low prices change as and when the price of Infosys changes. For example, if Infosys moves from Rs.1014.2 to Rs.1050, then the high price will reflect Rs. 1050 as the new high.
Notice that the LTP of Infosys is highlighted in green and ITC in red. If the current LTP is more than the previous LTP, the cell is highlighted in green else in red.
Have a look at the snapshot below:
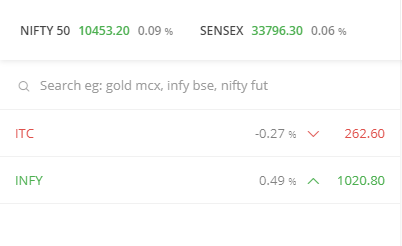
The price of Infosys moved from 1014.20 to 1020.80, and hence the colour changed to red from blue.
Besides the basic information about the LTP, OHLC, and volume we can also dig a bit deeper to understand the real time market participation. To see this, we need to invoke what is called a ‘Market Depth’ window also referred to as the snap quote window. As you can see, there is a lot of information in the snap quote window. I specifically want to draw your attention to the numbers in blue and red called the Bid and Ask prices.
You can use Kite by Zerodha more effectively by going through its user manual
9.6 – The Bid and Ask Price
If you want to buy a share, you obviously need to buy it from a seller. The seller will sell the shares at a price that he thinks is fair enough. The price that the sellers ask you is called the ‘Ask Price’. The ask price is highlighted in red. Let us analyze this in a bit more detail.
| Sl No | Ask Price | Ask Quantity | Number of Sellers |
|---|---|---|---|
| 01 | 3294.80 | 2 | 2 |
| 02 | 3294.85 | 4 | 2 |
| 03 | 3295.00 | 8 | 2 |
| 04 | 3296.20 | 25 | 1 |
| 05 | 3296.25 | 5 | 1 |
By default the snap quote window displays the top 5 bid and asks prices. In the table above we have the top 5 ask prices.
The first ask price is Rs.3294.80. At this particular moment, this is the best price to buy Infosys and there are only 2 shares available at this price being offered by 2 different sellers (both of them are selling 1 share each). The next best price is Rs.3294.85. At this price there are 4 shares available being offered by 2 different sellers. The third best price is Rs.3295 at which 8 shares are available, and this price is offered by two sellers. So on and so forth.
As you notice, the higher the ask price the lower is the priority. For example, at 5th position is an ask price of Rs.3296.25 for 5 shares. This is because the stock exchanges give priority to sellers willing to sell their shares at the least possible price.
Notice even if you want to buy 10 shares at Rs.3294.8 you can only buy 2 shares because there are only 2 shares being offered at Rs.3294.8. However, if you are not particular about the price (aka limit price) you can place a market order. When you place a market order at this stage, this is what happens:
- 2 shares are bought @ Rs.3294.8
- 4 shares are bought @ Rs.3294.85
- 4 shares are bought @ Rs.3295.00
The 10 shares will be bought at three different prices. Also in the process the LTP of Infosys will jump to Rs.3295 from Rs.3294.8
If you want to sell a share, you obviously need to sell it to a buyer willing to buy it from you. The buyer will buy the shares at a price that he thinks is fair enough. The price that the buyer demands is called the ‘bid price’. The bid price is highlighted in blue. Let us analyze this part in a bit more detail:
| Sl No | Bid Price | Bid Quantity | Number of Buyers |
|---|---|---|---|
| 01 | 3294.75 | 10 | 5 |
| 02 | 3294.20 | 6 | 1 |
| 03 | 3294.15 | 1 | 1 |
| 04 | 3293.85 | 6 | 1 |
| 05 | 3293.75 | 125 | 1 |
Again by default the snap quote window displays the top five bid prices. Notice the best price at which you can sell shares is at Rs.3294.75, and at this price you can only sell 10 shares as there are only 5 buyers willing to buy from you.
If you were to sell 20 Infosys shares at market price the following would be the execution pattern :
- 10 shares sold @ Rs.3294.75
- 6 shares sold @ Rs.3294.20
- 1 share sold @ Rs.3294.15
- 3 shares sold @ Rs.3293.85
So in essence, the bid and ask prices gives you information about the top 5 prices at which the buyers and sellers are stacked up. It is extremely important for you to understand how the buyers and sellers are placing their trades especially if you are an intraday trader.
9.7 – Conclusion
The trading terminal is your gateway to markets. Trading terminal has many features that are useful to traders. We will explore these features as we progress through the various learning modules. For now you should be in a position to understand how to set up a market watch, transact (buy and sell) in stocks, view the order and trade book, and understand the market depth window.
Key takeaways from this chapter
- A trading terminal is your gateway to markets. You must know the operations of a trading terminal if you aspire to become an active trader
- You can load the stock you are interested in on the market watch to track all the relevant information
- Some of the basic information on market watch is – LTP, % change, OHLC and volumes
- To buy a stock you need to invoke a buy order form by pressing ‘B’ key. Likewise, to sell a stock you need to invoke a sell order form by pressing ‘S’ key
- You choose a limit order type when you are keen on transacting at a particular price, else you can opt for a market order
- You choose CNC as product type if you want to buy and hold the stock across multiple days. If you want to trade intraday you choose NRML or MIS
- An order book lets you track orders that are both open and completed. You can modify the open orders by clicking on the modify button at the bottom of the order book
- Once the order is completed you can view the trade details in the trade book. In case of a market order then you can view the exact trade price by accessing the trade book
- You can press the F6 key to invoke the market depth or snap quote window. The market watch enables you to see bid and ask prices
- The bid & ask prices refers to the price at which you can transact. By default the top 5 bid and ask prices are displayed in the market depth window at all times.
Comments
Post a Comment